Market last week has been trading in a very narrow range led by reduced institution activity on the back of Christmas and New Year holiday.Action was in Midcaps/Smallcaps as both Index were up by 3.6% and 2.5% respectively. As we approach last week of the calendar year and NAV adjustments are likely to take place.FII flows will be keenly watched to see if the reduction in Federal Reserve’s stimulus has any impact on these investments.
Nifty Hourly Chart
Nifty Hourly charts are forming ascending triangle, with breakout coming above 6326, Unable to do so we can dip towards 6260 levels in coming 2 days.
Nifty Daily Chart
Nifty was in consolidation mode last week,moved in sideways trading range of 6260-6320.Any move above 6326-6239 levels with volumes can see Nifty , move on to its previous high of 6,415.But the inability to move higher and close above 6340 will drag the index down to 6,260 to 6207 over the next week. Also as per time analysis nifty can see a turn date around 2 Jan.
Nifty Gaps
For Nifty traders who follow gap trading there are 9 trade gaps in the range of 5300-6400
- 5285-5303
- 5448-5553
- 5680-5700
- 5780-5802
- 6030-5995
- 6092-6103
- 6278-6289
- 6326-6332
Fibonacci technique
Fibonacci fan
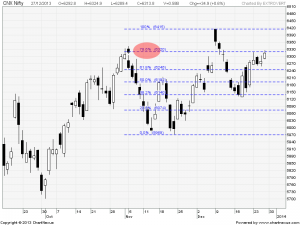
Nifty Fibonacci fan are wonderful tool to find the top and bottom in short term.Nifty made the life high of 6417 at resistance of Fibo Fan,Support comes at 6103 as per Fibo fan.
Fibo Retracement also signalling resistance@6320-6326 range. Bullish above that only.
Nifty Weekly Chart
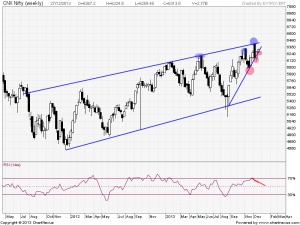
It was bullish week, with the Nifty was up by 40 and gaining 0.6% closing at highest weekly closing in history of Indian market @6314. Nifty held on to its weekly trendline which is bullish but Nifty is also forming Broadening Top formation on the weekly chart with negative divergence. So swords are drawn for both bulls and bears and who will again upper hand in 2014.
Trading Monthly charts
 Monthly momentum is still on upside till 6100 is not broken.FII has , pumped $2.5 billion in to equity this year with Nifty delivering a single digit return.
Trading Quarterly charts
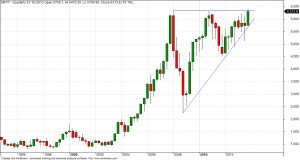
 31 December we will be ending the 3 Quarter. It has been good quarter for Indian market with Nifty rising almost 10%. This will be Highest Quarterly closing for Indian market.
Nifty Trading Levels
Nifty Trend Deciding Level:6326
Nifty Resistance:6362,6418 and 6467
Nifty Support:6259,6207 and 6130
Levels mentioned are Nifty Spot
Let me go by Disclaimer these are my personal views and trade taken on these observation should be traded with strict Sl
Want to see post in your Inbox,Register by adding your email id in Post in your Inbox section
Follow on Facebook during Market Hours: https://www.facebook.com/pages/Brameshs-Tech/140117182685863


quite informative and detailed analyse about nifty.
very good.keep going.
Thanks !!
Rgds,
Bramesh
Hi Bramesh,
Very detailed analysis. I have been following your analysis of NIFTY & your stock recommendations since a week and find your studies and analysis accurate.
KEEP UP THE GOOD WORK. GOD BLESS YOU.
Thanks
Thanks VK sir..
Rgds,
Bramesh