Yes Bank
Pennant formation signalling an explosive move is round the corner.
Buy above 364 Tgt 368,375 and 390 SL 358
Sell below 355 Tgt 351,343 and 338 SL 358
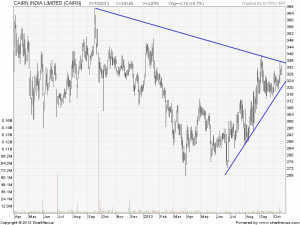
Cairn India
Buy above 331 Tgt 336,342 and 354 SL 328
Sell below 324 Tgt 320,316 and 311 SL 328
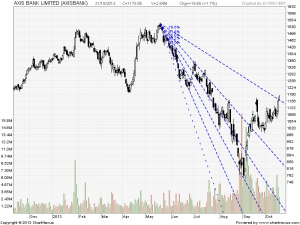
Axis Bank
 Unable to cross its Fibo resistance, Pullback can come if unable to close above 1205 odd levels.
Buy above 1176 Tgt 1186,1200 and 1214 SL 1170
Sell below 1159 Tgt 1146,1135 and 1120 SL 1162
Stock Performance Sheet for the Month of September is Updated @http://tradingsystemperformance.blogspot.in/ Net Profit for the month of Sep is 1.82 Lakh and Oct Month 1.92 Lakh
Stock Performance Positional sheet for Sep Month is updated on http://positionalcallsperformance.blogspot.com/ Net Profit for Sep Month 2.35 Lakhs , Oct Month 1.85 Lakh
- All prices relate to the NSE Spot
- Calls are based on the previous trading day’s price activity.
- The call is valid for the next trading session only unless otherwise mentioned.
- Stop-loss levels are given so that there is a level below/above, which the market will tell us that the call has gone wrong. Stop-loss is an essential risk control mechanism; it should always be there.
- Book, at least, part profits when the prices reach their targets; if you continue to hold on to positions then use trailing stops to lock in your profits.


You are simply the Rockstar Bramesh Sir; YES Bank and Axis Bank took a rocket to reach their targets instead of taking a flight