


Last week we gave Trend Deciding level as 5946 Nifty Nifty achieved 2 weekly target on upside and 1 weekly target on downside so traders were able to capture both upside and downside move :).
IIP data was a big shocker August #IIP growth at 0.6% vs 2.6% in July and No Deal on US Debt ceiling are big negative events devloped on Weekend, Inflation data will be coming on Monday and will lead to volatility in Stock market. Reliance Results will be declared on Monday after market close.
Next Week we are having Holiday on 16 October
Lets analyze how to trade Nifty next week.
Nifty Hourly Chart
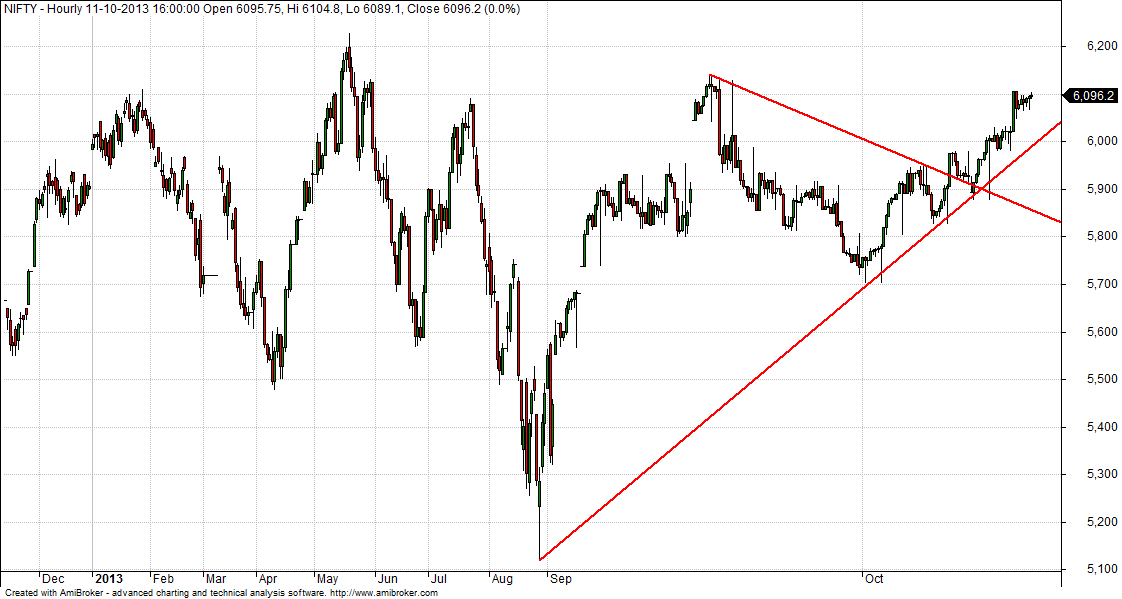
Nifty Hourly charts is still trading above trendline crossover and support exits at 6020-6010 range.Breaking below it Nifty can break all the way through the 5850 odd levels.
Nifty Gaps
For Nifty traders who follow gap trading there are 5 trade gaps in the range of 5300-6000 and all other gaps got filled.
- 5285-5303
- 5448-5553
- 5680-5700
- 5780-5802
- 6046-6021
Nifty Daily Chart Time Analysis
Nifty Daily chart has formed Hammer candlestick pattern which has formed in uptrend, If tommrow Nifty opens with gap down and unable to fill the gap for next 2 days we have formed a short term top.

Fibonacci technique

As per of Fibo Retracement theory Nifty will now take support at 5924.
Fibonacci fan

Nifty Fibonacci fan are wonderful tool to find the top and bottom in short term.Nifty was unable to close above the Fibo Fans at 6107.Unable to cross 6107 Nifty can fall all the way upto 5825 odd levels.
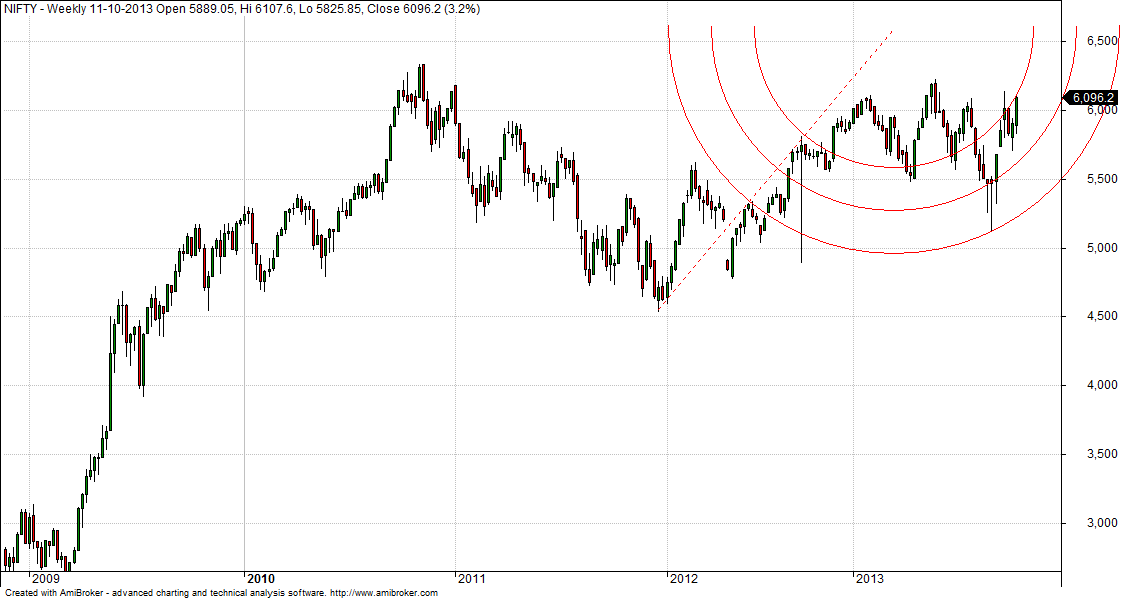
Nifty Weekly Chart
Trading Monthly charts
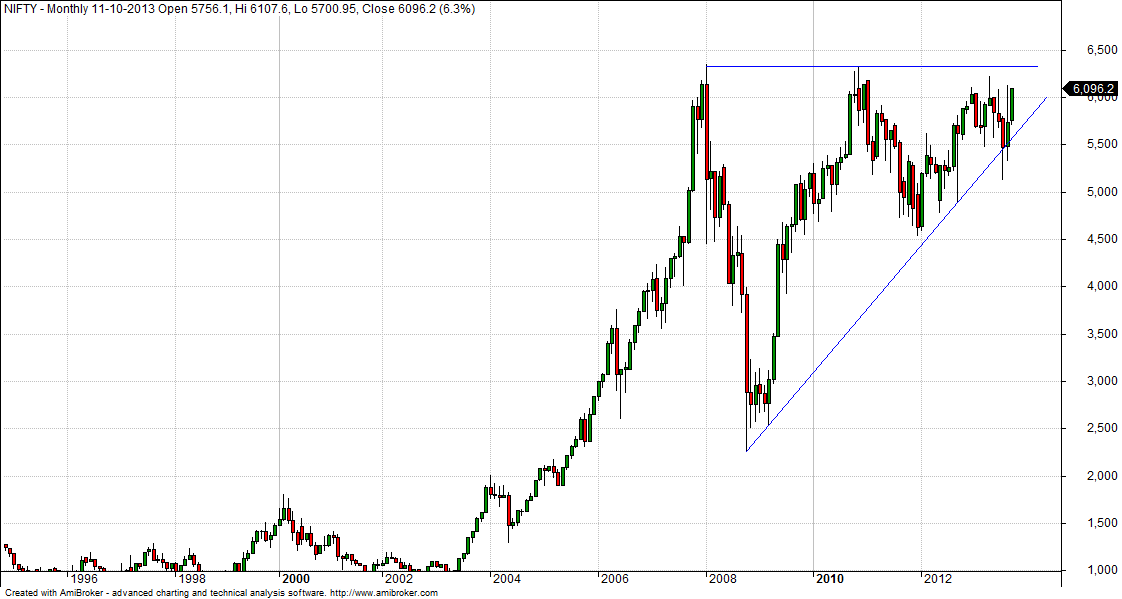
Looking at monthly chart I am expecting October to be a choppy month confusing market participants looking at previous price patterns.
Nifty Trading Levels
Nifty Trend Deciding Level:6010
Nifty Resistance:6077,6142 and 6207
Nifty Support:5946,5898 and 5825
Levels mentioned are Nifty Spot
Stock Performance Intraday sheet for Sep Month is updated on http://tradingsystemperformance.blogspot.com/
Stock Performance Positional sheet for Sep Month is updated on http://positionalcallsperformance.blogspot.com/
Let me go by Disclaimer these are my personal views and trade taken on these observation should be traded with strict Sl
Want to see post in your Inbox,Register by adding your email id in Post in your Inbox section
Follow on Facebook during Market Hours: https://www.facebook.com/pages/Brameshs-Tech/140117182685863
what is the nifty gaps..how to look and study the level..i didn’t get the basic of it ?if yu can put some light on it
Dear Biju,
Its covered in my trading course.
Rgds,
Bramesh
sir,great
Thanks ..
Rgds,
Bramesh
Dear Bramesh,
It appears that there is some incorrectness in the resistance levels. How can 6077 be resistance while the close is at 6096. Please correct levels. Thanks
Dear Dinesh,
Levels are perfectly alright. See them keeping in perceptive of Weekly Trend Deciding level.
Rgds,
Bramesh
Is there chance for evening star pattern.
Yeah most likely if tomorrow gap down happens.
Rgds,
Bramesh
I think it is hanging man candle.