


Tata Motors
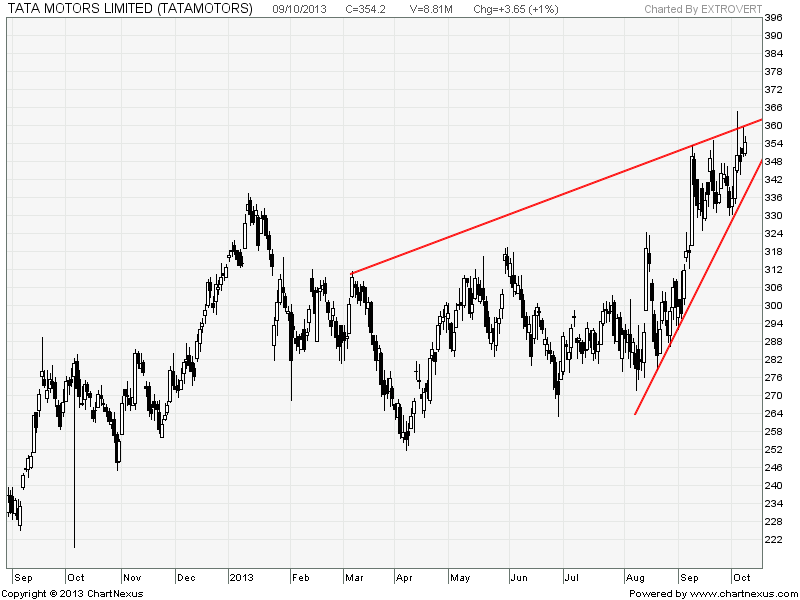
Formation of risisng wedge in Telco,with range contraction.Stock has also formed double bottom at 350 odd levels.
Buy above 357 Tgt 359.5,363 and 365 SL 356
Sell below 353 Tgt 351,347 and 344 SL 354.2
Hindalco
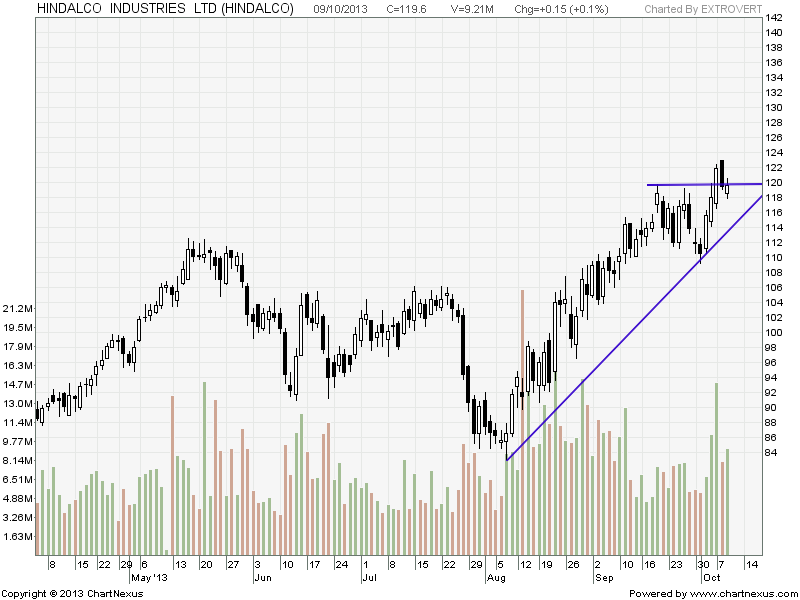 Hindalco gave a range breakout but was unable to sustain above it, Positional traders keep eye on 123 odd levels ANy close above it gives target of 131.
Intraday Traders can use the below levels
Buy above 119.5 Tgt 120.8,122 and 123 SL 119
Sell below 117.8 Tgt 116.6,115.4 and 113 SL 119
Asian Paint
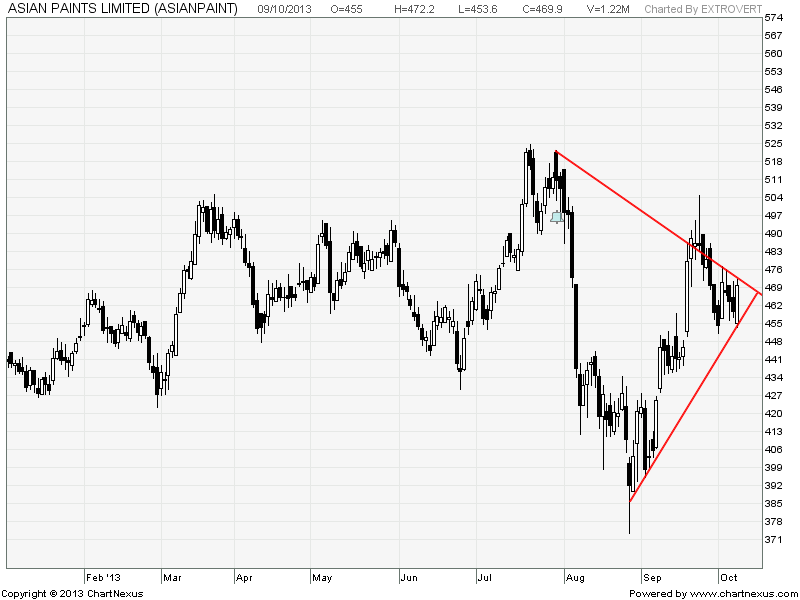 Asain paint formed symmetrical triangle with a Bullish engulfing pattern.
Buy above 473 Tgt 476,480 and 483 SL 470
Sell below 469 Tgt 466,463 and 459 SL 472
Stock Performance Sheet for the Month of September is Updated @http://tradingsystemperformance.blogspot.in/ Net Profit for the month of Sep is 1.82 Lakh and Oct Month 66.6 K
Stock Performance Positional sheet for Sep Month is updated on http://positionalcallsperformance.blogspot.com/ Net Profit for Sep Month 2.35 Lakhs
- All prices relate to the NSE Spot
- Calls are based on the previous trading day’s price activity.
- The call is valid for the next trading session only unless otherwise mentioned.
- Stop-loss levels are given so that there is a level below/above, which the market will tell us that the call has gone wrong. Stop-loss is an essential risk control mechanism; it should always be there.
- Book, at least, part profits when the prices reach their targets; if you continue to hold on to positions then use trailing stops to lock in your profits.
Oops I meant Tata Motors 😉
Cheers,
Bhavin
Njoy Bhavin 🙂
Rgds,
Bramesh
Asian Paints was a bonus today 🙂
Cheers,
Bhavin
Super calls Bramesh.
Again today for all the 3 stocks buy side targets achieved.
Cheers,
Bhavin
Thanks Bhavin 🙂
Rgds,
Bramesh