


State Bank of India is scheduled to declare its earnings for the quarter ended March 2013 on Thursday tomorrow during market hours around 1 PM. SBI being an index heavyweight will also decide the trend of Nifty. Its a great day to make money if you are on right side of trade. We have covered LT in today morning analysis and we were able to catch both upside and downside move as per levels :). So lets discuss SBI analysis in details.
Stock will be highly volatile today and traders are advised to use extreme caution when trading SBI, trade as per levels and stick with SL and keeping booking profit.
SBI Hourly
 2271 is the trendline resistance on Hourly charts. High Volume Trade was done in 2208-2218 range so any downside strong support lies in range of 2208-2218
SBI Daily

SBI closed at triangle support, break of triangle leads to trending moves as seen in LT today so if 2333 breaks, big downside move is on cards.
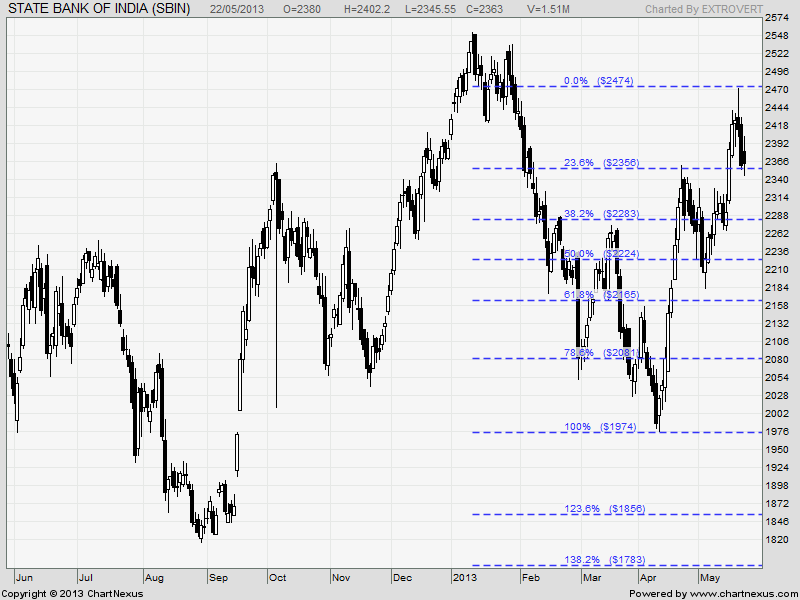
SBI Fibonacci Levels
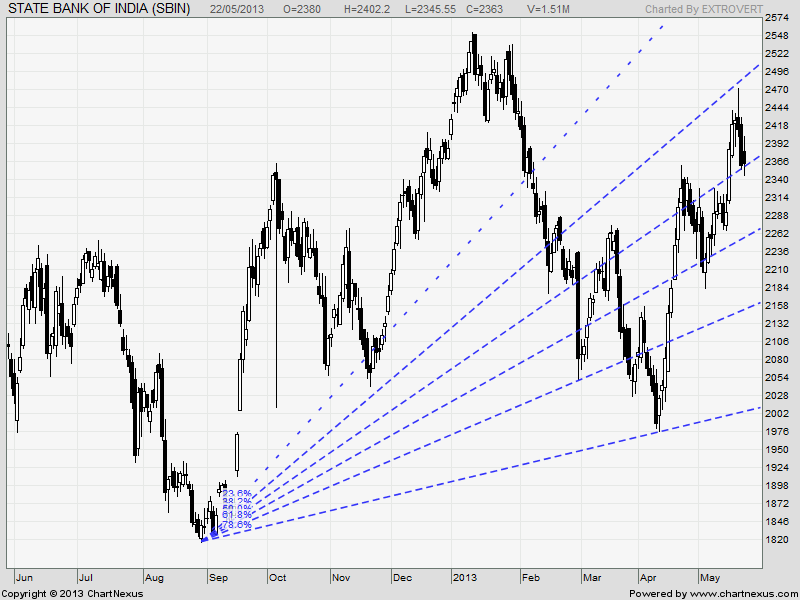
SBI Fibo Fans
Buy above 2371 Tgt 2392,2425 and 2450 SL 2363
Sell below 2333 Tgt 2313,2282 and 2266 SL 2350
All prices relate to the NSE Spot
We do discussion in Live market to update Nifty levels If you are interested you can LIKE the page to get Real Time Updates.
Follow on Facebook during Market Hours: http://www.facebook.com/pages/Brameshs-Tech/140117182685863