


USD has surged to 3 year high as market rumors are going Fed will cut down on QE in coming months. USD is trading at 84.393 highest level sinse July 2010.Lets analyze technically how long can the move last.
USD Hourly Chart
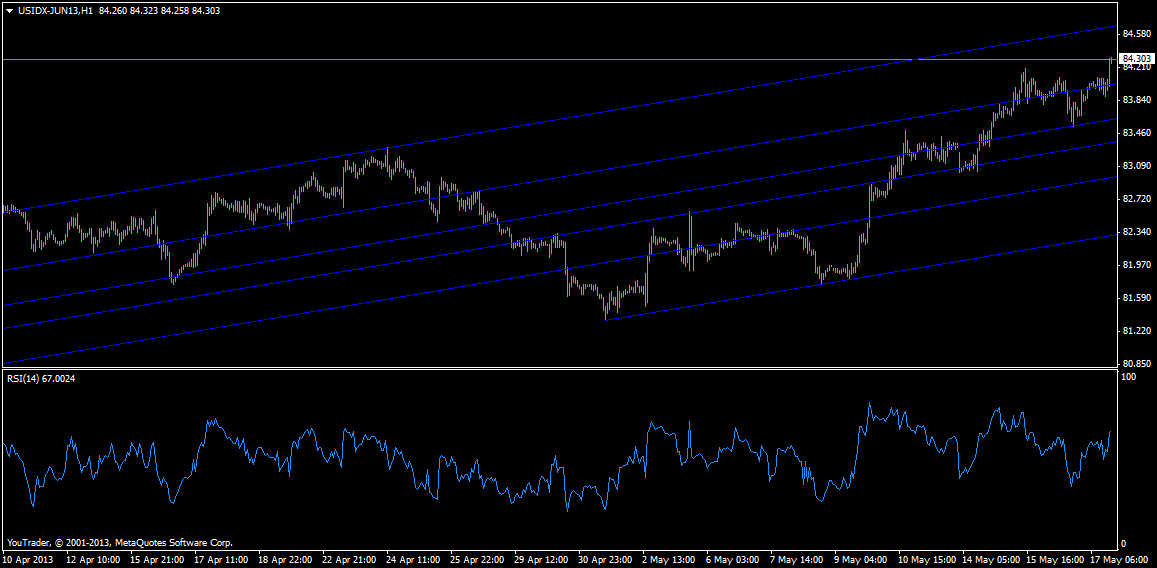
As per hourly charts USD is trading above its Fibo channel line and next target comes at 84.55. Observe the chart closely how every fibo channel is providing support for rise to continue.Any dips towards 83 should be bought into.
USD Weekly Chart
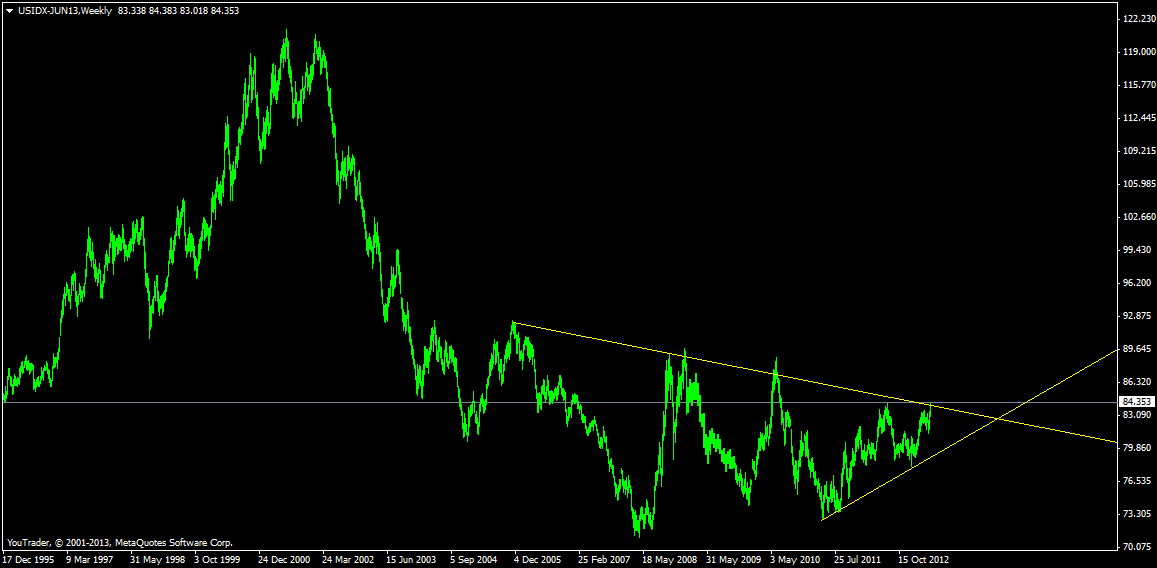
As per weekly chart, USD has given a breakout of symmetrical triangle target of breakout comes around 90 odd levels in next 6 months time frame.
USD Monthly Chart
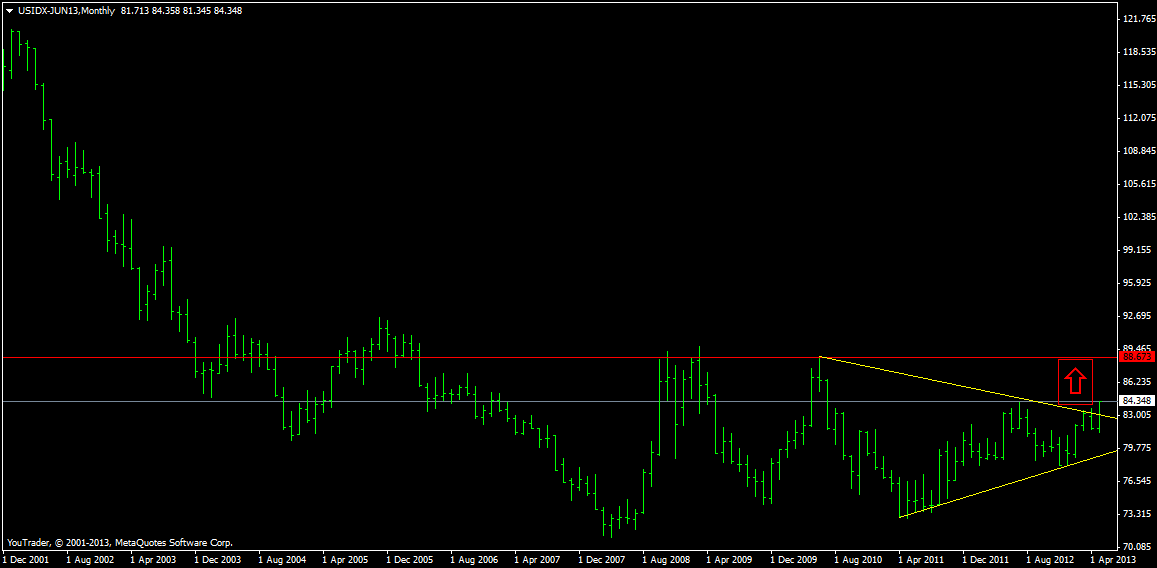
Monthly charts are looking bullish and next level of resistance comes at 88.67 market by red line.
Dips should be bought in USD for target of 84.55 ,86 and 88.67
Follow on Facebook during Market Hours: http://www.facebook.com/pages/Brameshs-Tech/140117182685863