


The EUR/USD pair made high of 1.36 on 1 feb and has been falling mode with Cyprus Bailout and overall economic deterioration of EU countries, However, we are reaching a fairly noisy area below, and we think the 1.28 level should continue to be a “bottom” to the market for the time being. We have analyzed the chart in 4 hour, daily and weekly time frame which suggests 1.28 should be the bottom for the time being.
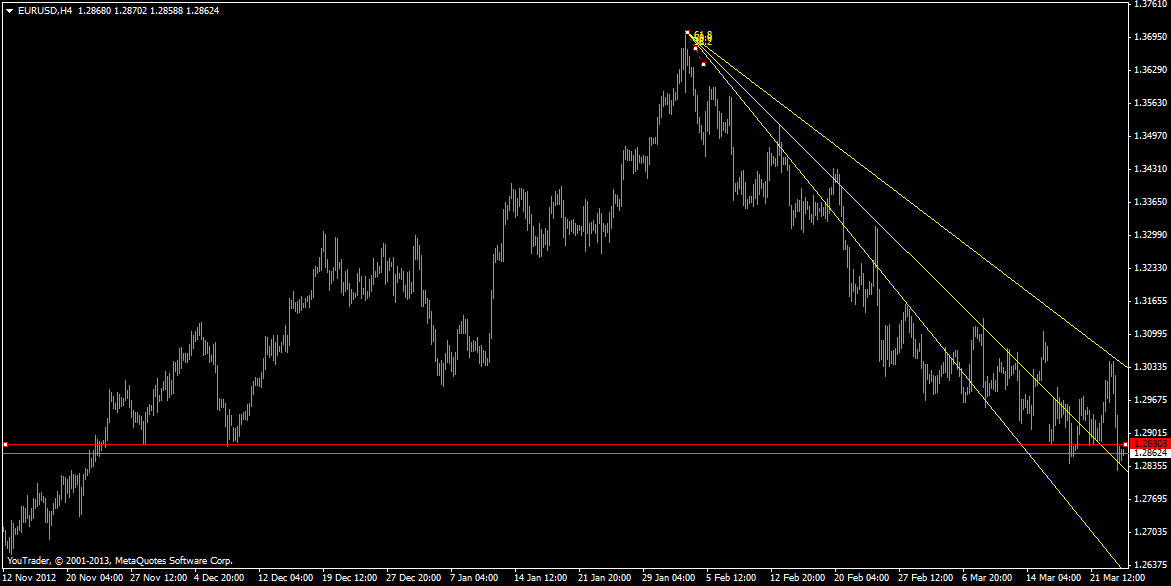
EUR/USD 4 Hour Chart

Fibonnaci Fans has been helpful is finding potential tops and bottom of financial instrument. Applying the same on EUR/USD pair shows EUR/USD has been repecting the arcs line. Yesterday session it touch the bottom of arc and pullback rally has started. Major short covering and value buying will come once it close and sustain above 1.2810.
EUR/USD Daily Chart
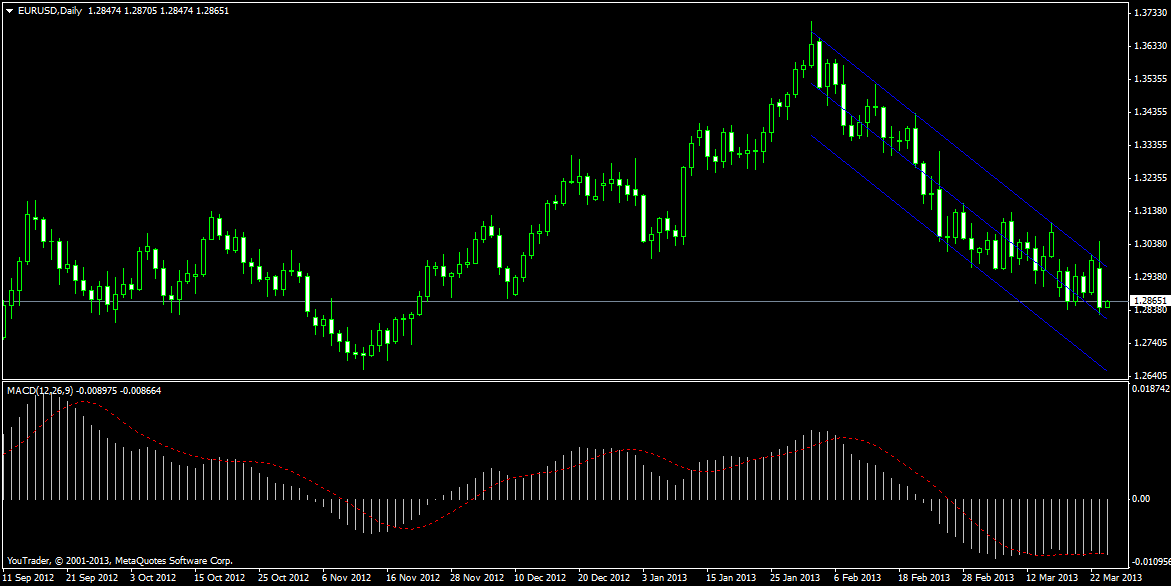 Daily chart we have applied linear regression channels and pair has again found support and bounced from the bottom of linear channel.MACD histogram is highly oversold suggesting relief rally is on cards.
EUR/USD Weekly Chart
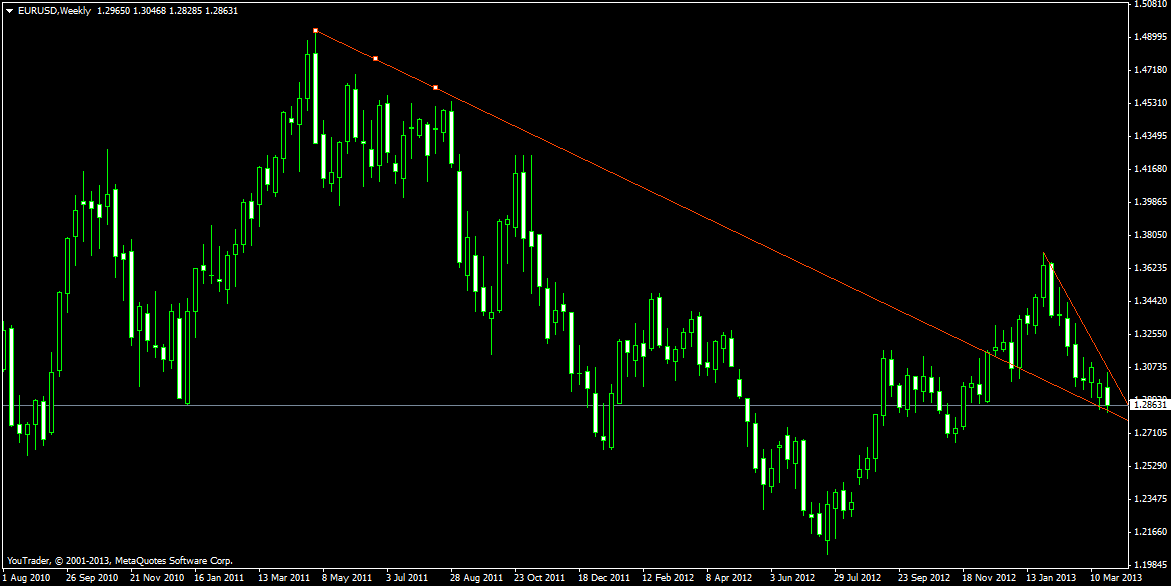
Weekly charts is forming a falling wedge pattern which is bullish in nature.
Longs can be initiated above 1.2880 Tgt 1.2909,1.2947,1.2990 with SL 1.2863
Hi,
Do you track USD/INR as well? If you do, then can we have an analysis of the same.