


Infosys
 Infosys share has been on a roll after its Q3 results, stock is one of the biggest gainer in Nifty in past 2 months,gaining 27% till date. Stock is approaching a crucial resistance zone of 2980-2994, where the share has shown pullback past 3 times. Negative divergence are clearly visible in daily charts so probability of showing a pullback from the resistance range of 2980-2994. Positional trades can book profit in this range.
Sell below 2956 Tgt 2940,2926 and 2908 Sl 2970
Risky trader can use the range of 2994-3000 to initiate short keeping a strict sl of 3009
United Spirits
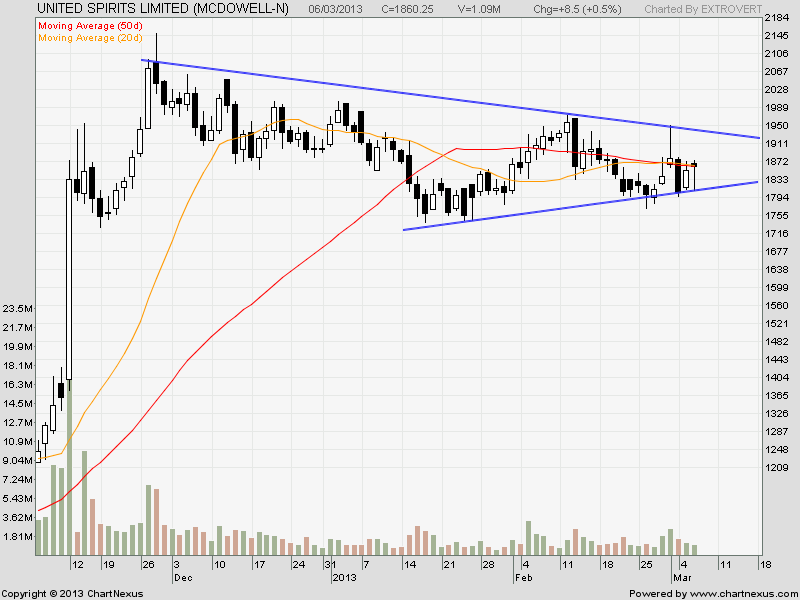
United Spirits has been stock seems to have taken resistance from its short term and mid-term cluster of moving averages (as shown in the chart).
Buy above 1875 Tgt 1887,1913 and 1936 SL 1860
Sell below 1846 Tgt 1822,1809 and 1784 SL 1860
Rcom
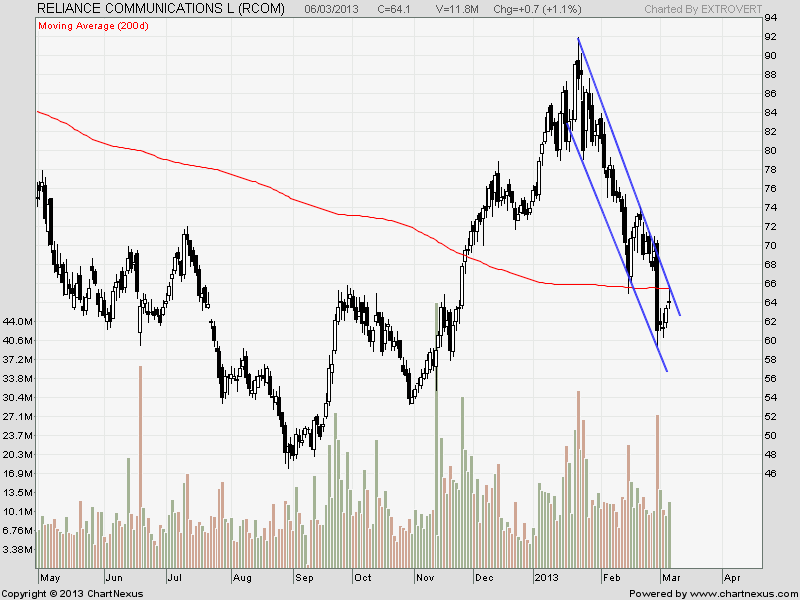
Rcom share value reacted from its 200 DMA today @66.3 and formed doji pattern with trading in a firm down trending channel.
Buy above 64.4 Tgt 65.4,66.7 and 67.7 SL 64
Sell below 63 Tgt 62,61 and 60 SL 64
- All prices relate to the NSE Spot
- Calls are based on the previous trading day’s price activity.
- The call is valid for the next trading session only unless otherwise mentioned.
- Stop-loss levels are given so that there is a level below/above, which the market will tell us that the call has gone wrong. Stop-loss is an essential risk control mechanism; it should always be there.
- Book, at least, part profits when the prices reach their targets; if you continue to hold on to positions then use trailing stops to lock in your profits.
We do discussion is Live market to update Nifty levels If you are interested you can LIKE the page to get Real Time Updates.
Follow on Facebook during Market Hours: http://www.facebook.com/pages/Brameshs-Tech/140117182685863