


At last GOI bite the hard bullet and gave a partial deregulation of diesel which fueled rally in Oil and Gas Sectors where two heavy weight Reliance and ONGC. RIl came up with a spectacular set of number and closed almost 4% up in London exchange. As i always say price have everything in it, RIL we discussed on 17 Jan Post saying above 870 Inverse HnS pattern will start showing its effect and mid term target of 1000.
Trends in motion will stay in motion, they will persist, until they reverse.
Lets discuss Nifty Trading Strategy for Next week.
Nifty Hourly Chart

Nifty is trading comfortably above 50 SMA which lies at 6019. Negative divergences have been observed in Hourly chart but we need price confirmation till 6019 is not broken. Ride the horse in the direction it is going.Hourly trendline resistance comes at 6090.Monday we need to close above it as Nifty should open gap up above 6090 but closing should be watched closely.
Nifty Gaps
For Nifty traders who follow gap trading there are 4 trade gaps in the range of 5077-5900.
- 5727-5736
- 5856-60
- 5870-5880
- 5951-5982
- 6039-6048
So these levels should be noted down carefully by Nifty trader to find further Nifty support and resistance.
Nifty Daily Chart
Technically till 5920 is not broken market will continue with its trend . This is what we discussed in Jan 7 and Nifty made a low of 5940 and again turned back hope traders made use of analysis were able to benefit out of the rally. Now as per daily chart we are at a crucial juncture where next 100 points rally can come swiftly. Break of of 6084 can see a quick move till 6150-6220 as per below chart.

Nifty is also forming rising wedge pattern and support coming at 6030.
Nifty Daily Chart with Indicators

Nifty took out resistance at the top end of channel at 6080 and gap up opening tomorrow will help to get over this resistance levels. MACD indicator is going into sideways move and RSI and Stochastic have moved out of negative divergence mode.
Fibonacci technique

As discussed earlier Fibonacci fan helps in finding potential tops and Bottom of market from short term prospective. If we see the chart closely with Fibonacci fans 6200 is level of resistance, and 5978 is level of support Nifty as per Fibo Fans
Nifty Weekly Chart

Trading Monthly charts
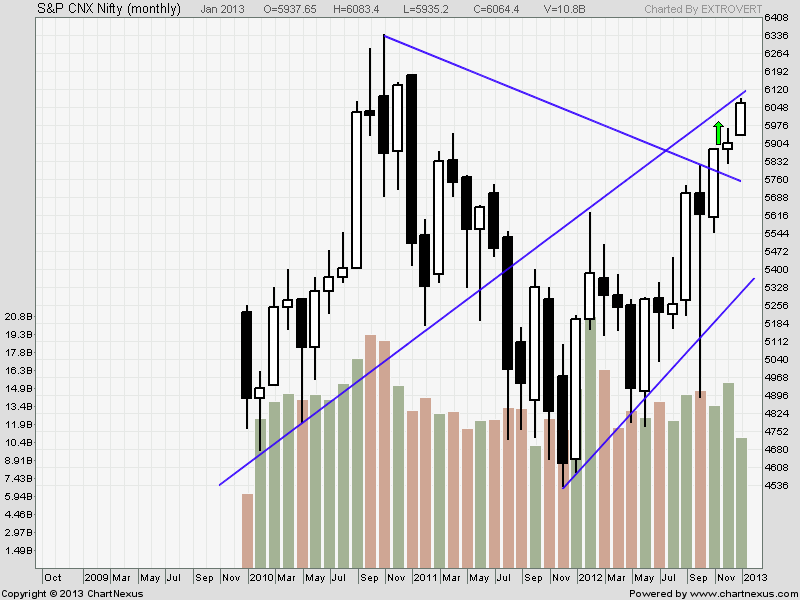
Monthly chart are approaching higher end trendline at 6100 closing above it will give a fresh breakout in monthly chart.
Nifty Trading Levels
Nifty Trend Deciding Level:6100
Nifty Resistance:6158,6180 and 6220
Nifty Support:6030,5990 and 5951
Levels mentioned are Nifty Spot
Let me go by Disclaimer these are my personal views and trade taken on these observation should be traded with strict Sl
We do discussion is Live market to update Nifty levels If you are interested you can LIKE the page to get Real Time Updates.
Follow on Facebook during Market Hours: http://www.facebook.com/pages/Brameshs-Tech/140117182685863