


Nifty gave then Highest Weekly Close in last two Years (2011-2012).Nifty and Sensex continued with there consolidation phase, positive takeaway from last week’s movement is that the Sensex is holding above 19,000 and the Nifty continues above 5,825 which gives bullish touch this phase of consolidation. All eyes on US fiscal cliff talks which are going on in US? All Financial Markets are having eyes on Will US be able to avoid the Fiscal cliff? Want to Know what is Fiscal Cliff (The Fiscal Cliff Explained http://bit.ly/VJAcSS)
Lets discuss Nifty Trading Strategy for Next week.
Nifty Hourly Chart
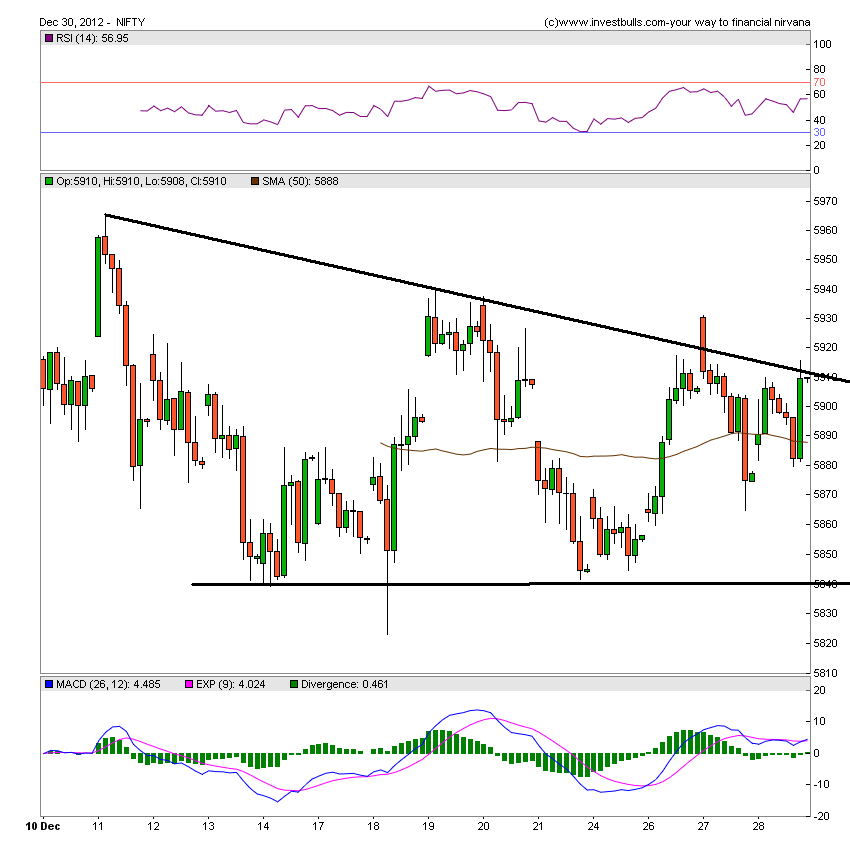
Nifty continues to trade above or below the important 50 Hour SMA , as discussed in last post till 5930-5830 is not crossed either stay out of trade or buy support sell resistance. As a matter of fact many traders who have interacted with me have almost lost all profit they made in November month rally. Making money is not important protecting the profit in Stock market. Its almost 13 trading days nifty has been trading range 5823-5930 after breakout on November expiry.
Nifty Gaps
For Nifty traders who follow gap trading there are 8 trade gaps in the range of 5077-5900.
- 5043-5077
- 5238-5309
- 5303-5309
- 5399-5415
- 5435-5526
- 5635-5658
- 5666-5651
- 5727-5736
So these levels should be noted down carefully by Nifty trader to find further Nifty support and resistance.
Nifty Daily Chart
As discussed last week resistance of previous rise ie.5815-25 will become support for any downfall to come in Nifty. December Expiry Nifty took support at 20 SMA@5866 and bounced back smartly as shown in below chart. We have mentioned 2 week back 5950-5965 is an important supply zone range and Nifty made top at the 5965 and unable to breach it till date.
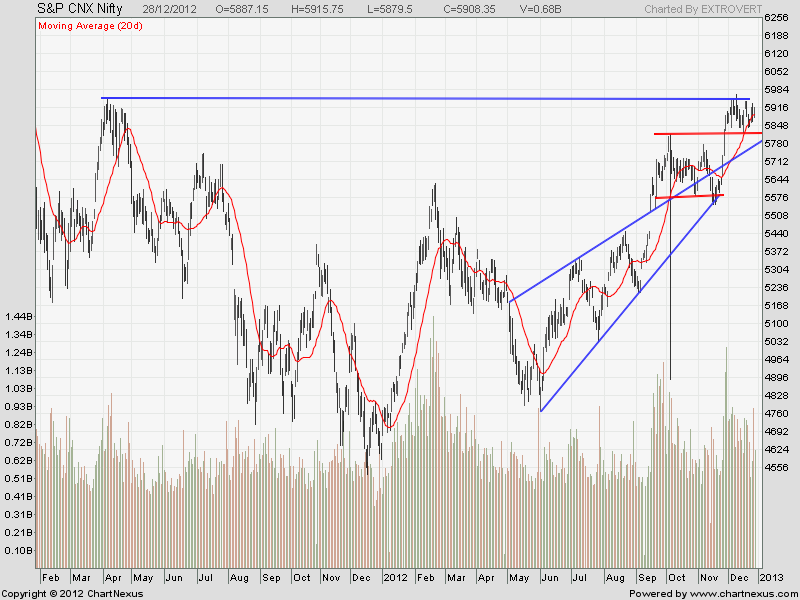
If one observe the Nifty cycle closely 21 trading session are spent in zone of consolidation in range of 5965-5823 after a rise of 200-250 points in Nov last week. So till traders do not see a breakout/breakdown trade in less qty. Do not repent on losing 30-50 points but rejoice getting 150-200 points. Always remember market make 80% of move in 20% of times.
Nifty Daily Chart with Indicators

Nifty is taking resistance at the top end of channel so 5930 becomes an important resistance before 5965 is crossed. MACD is given a SELL, RSI is still showing negative divergence.
Continue Reading for Weekly Charts and Weekly Levels
Let me go by Disclaimer these are my personal views and trade taken on these observation should be traded with strict Sl
We do discussion is Live market to update Nifty levels If you are interested you can LIKE the page to get Real Time Updates.
Follow on Facebook during Market Hours: http://www.facebook.com/pages/Brameshs-Tech/140117182685863