


Successful traders only control three things all the time: Initial Risk, Exits, and EMOTIONS…
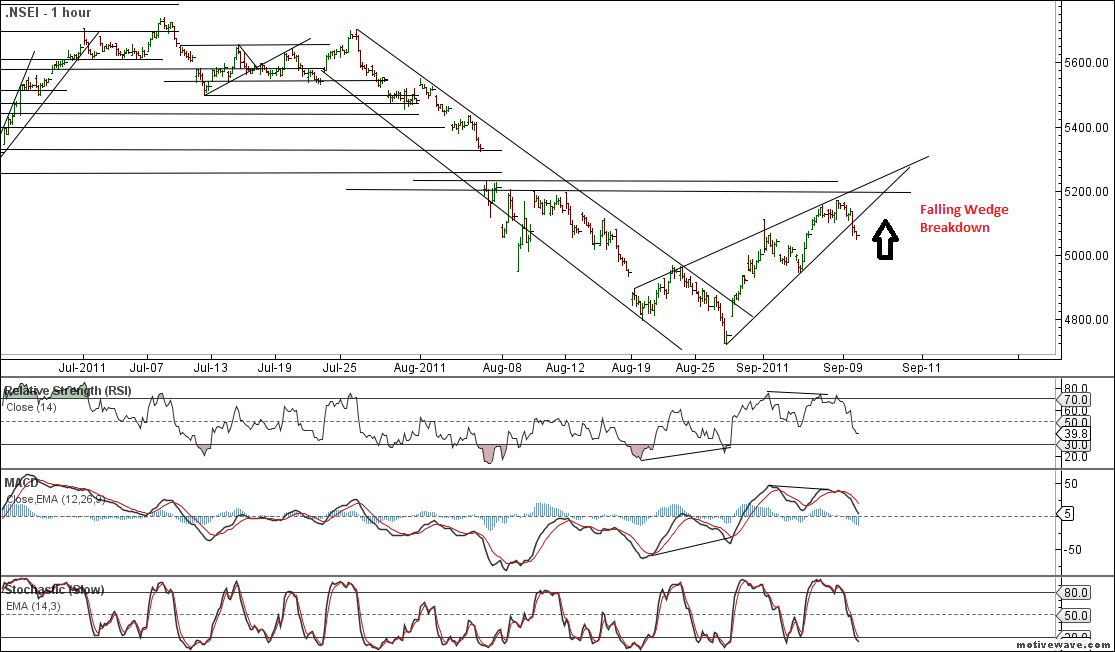
Nifty Hourly
") Nifty Hourly chart has shown a Rising wedge formation. The Pattern is active and shown its effect in Friday’s correction
Nifty Hourly chart has shown a Rising wedge formation. The Pattern is active and shown its effect in Friday’s correction
The rising wedge is a bearish pattern that begins wide at the bottom and contracts as prices move higher and the trading range narrows.
Nifty Hourly has broken the trendline of Rising wedge as shown in above chart.Correction happened near the supply zone of 5177-5196 these are levels where Nifty took support before the correction in August and these become the Resisting points.
Nifty Daily Chart

On Daily chart Nifty is on verge of breaking the rising channel.Lower support of the Channel comes at 5043 levels. Breaks of this level and close below 5043 on Monday will be bearish in short term.
Support comes at previous resistance 5015(Double Top was formed),4965(Swing High in last downtrend),4950.4931.

Short term reversal will come on a weekly close below 4931.5177 and 5196 were the supply area and market corrected from that level.The Major concern of this upmove was Volumes,the rise from 4965-5165 was on very low volumes .The Nifty Contract traded were in range of 3.6-3.8 Lakhs which is the lowest in 22 Sessions.
As I have mentioned many times before Upmove without volumes get Sold off very easily and same thing happened on Friday.
From 5052-5165 we took 3 days to reach the levels which got sold of in matter of 2 Hours with good volumes.
Contract traded on Friday were Highest in last 5 days ie. 4.6 Lakhs Contract. Always look at volumes on Nifty Futures to get a feel of the Strength of upmove and down move.
Nifty Weekly Chart
 On Week on Week Basis Nifty has Nifty is up just 0.4% with the formation of Higher High and Higher Lows.
Close below 5039 will bring Nifty Weekly also in downtrend on Weekly basis and it will be SELL ON RISE below 5039.
Nifty will gain its positive momentum only above 5169 levels only for more upsides to come in coming week in this September Series.
On Downside break of 4806 will TERMINATE this intermediate upmove and we will make lower lows below 4720.
Nifty Monthly Chart
 On Monthly chart Nifty is up 1.2% and Break of 5092 on closing basis has turned the Monthly Chart ripe for more downsides.
Nifty Fibo Channels
 I had discussed this Fibonacci channels in my previous Weekly post and would like to revisit again. It gave us the Right opportunity to enter long above 5052 levels and we made almost 100 Points. Now this breakout is being tested @5052 levels. Close bbelow this will terminate the uptrend as per Fibo Channels.
Nifty Futures range based on Open Intrest
Nifty Futers was 5003 30th August and On Last Friday Nifty Futures closes at 5053. So we had a rally of 50 points but the interesting part is Open Interest of Nifty Futures rose by 30 Lakhs Contract which means Longs are Built in in System
AS Price Rise with OI Rise is Bullish.
At Indiviual Strike Price 4700 PE has Highest OI of 74 Lakhs Contract which remains the bottom of series and 5200 CE has highest OI of 59 Lakhs which remains the Top end of Series.
Now 4900 PE and 5000 PE has seen an OI reduction of 6 Lakh and 4 Lakh contract each which gives a Clue that we can revisit these levels again by next week.
In September we have quarterly adjustments of NAV’s by Mutual Funds and ULIPS in which the MF has to show an increase in there NAV and based on this they will buy more and market should rise (This is just an Observation). So, unless global cues present some really bleak picture, we may have a green series.
Nifty Trend Deciding Level:5052
Weekly Resistance:5120,5177,5225,5320
Weekly Support:4965,4931,4895,4831 and 4806
STAY DISCIPLINED !!
hello sirji
same from my side also no matter i trade or not, i daily read your analysis exceleent & fantastic. its good to have charting software too on your site 😆 thanks
Thanks Gopalji for your kind words on analysis.
I wish you best of luck for your trading. Hope you are minting money with system 🙂
Rgds
Hi Bramesh,
Please let me know from where do you get the NIFTY volume data??
Please post the link from where you get this data.
Regards,
– Vinay Gaonkar.
Sir,
Please open nseindia.com Go for Nifty Future quote you will see the Volume traded.
Rgds
Bramesh,
I think you are referring this url.
http://www.nseindia.com/live_market/dynaContent/live_watch/equities_stock_watch.htm?cat=N
Let me know from where can I get historic Nifty Volume data.
Regards,
– Vinay.
You can get that from Bhav Copy
Dear Bramesh Sir,
No matter whether I trade or not, but I find lot of interest in your analysis and there is no day that I have missed reading your articles. It really gives me lot of pleasure in reading your analysis. Thank you so much sir.
Dear Sir,
Thanks a lot for your Kind Words. it give me the required booster to keep going ahead.
Do let me know any suggestion for improvement.
Thanks Again.
Rgds
Bramesh
Hi Bramesh,
Excellent analysis! 😉
Regards
K B Raut
Thanks a lot Sir but still no where in front of your analysis..
UR the BEST