Nifty Daily Chart
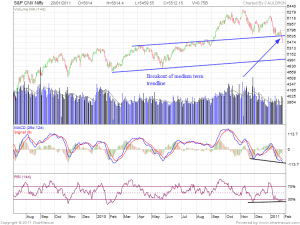
Nifty Daily chart post a grim picture we have broken 200 DAM and sustained below it for 2 days.Medium trend charts shows break in trendline from the rally started at 5460 levels to 6100.
RSI is oversold and MACD is also giving bearish signal.Whole street is bearish and looking at the way dow closed and Riots in Arabian countries which can effect the geo-political set up can add more fuel to fire and we can see more blood on street in coming week.
Till 5460 is protected rally can move till 5625 but once 5460 break we can see 5430 and 5380 on downside.Trade with trend
Nifty Weekly Chart
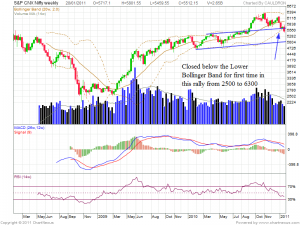
The unexcepted happen market closed below the lower end of Bollinger band on weekly chart which is not at all a good sign for bulls.
From the rally of 2500 to 6300 Nifty never closed below lower end of BB on weekly chart now it is cause of concern as Nifty has broke the weekly trendline channel also which also indicate bearishness.
RSI is approaching oversold region but still selling can be witnessed on Monday MACD is on sell side
Nifty Weekly Pivot:5591
Resistance:5722,5933
Support:5380,5249
Nifty Monthly Chart
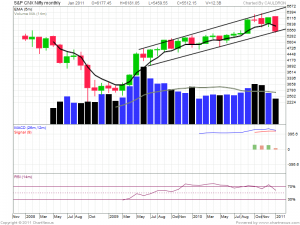
On Monthly Chart we are down 10% for the month of Jan and closed below 5 Month EMA @5717. Monthly charts have been butchered by bears.
 If we see the Montly chart we are on Trendline support of 5460 which is formed after joining Jul 2009 low to Dec 2011 Low.
Monthly Pivot is at 5254 and resistance at 5717.
If Friday’s low of 5460 breaks than we can move towards 5400 levels easily and if 5460 is protected than we can move towards 5600 levels.
Nifty Open Interest Chart
 Nifty Open Intrest shows put biuld up at 5400 and call build up at 5800.
Nifty range is from 5400- 5800 for next week as per Open interest data,short covering rally will come and use it to dump your longs.


hi, i was for a buy call on nifty for positive divergence on last saturday. on monday opening it was around 5422 and whole week traded above that and high made at 5566..but on last day it was as per u r views closed in deep red.now what for next week?
Hi Bramesh,
Nice detailed Post ,Thanks .
I have posted analysis of different Time Frames of the market in my blog ,The Third Eye -http://aar-vee.blogspot.com/ , Please have a look and leave your comments and observations .
Regards.
In first chart i can see a bullish divergence RSI with nifty..in my views we can see a bounce from here contrary to your bearish views. spot closing 5512 . will see next saturday for the effect o divergence RSI
Hi,
Positive divergence is present but price needs to confirm it by closing above 5 EMA on closing basis.Till we do not have price confirmation divergence effect can be ignored.
Please share your comments on this
Rgds
Regarding your point on closing below bollinger band in nifty weekly charts. From what i have read on the net is that whenever a stock closes below the lower band of bollinger band it means that it is an opportunity to buy. i.e. the stock is oversold. …can you please clarify if i am wrong can you add something to what i have said which would make more sense.
thanks a lot.
Abhishek
Hi Abhishek,
Well stock can keep on grinding lower and keep on closing below the Bollinger Band. To add to your nifty in its bull run has never closed below a Lower BB.
Next week we need to see how index reacts because if it closes below it next week also we will be in serious trouble.
Looking at geo political crisis across middle east countries crude can rise which can have negative effect on india economy.
As per EW waves we are in 3 C which is fast ans swift correction with closing below lower BB.
Tough times ahead
Rgds