Hi All,
Today i will explain one more Trading System which is known as CAMARILLA Pivot Point which will come Handy for Day Trading Purpose.
Origins of the Camarilla Equation:
Discovered while day trading in 1989 by Nick Stott, a successful bond trader in the financial markets, which uses a truism of nature to define market action – namely that most time series have a tendency to revert to the mean. In other words, when markets have a wide spread between the high and low the day before, they tend to reverse and retreat back towards the previous day’s close. Input to the Systems is yesterday’s open, high, low and close. These levels are, frankly, astounding in their accuracy as regards day trading, even to seasoned traders, who know all about support and resistance, pivot points and so on.
Camarilla Equation Levels:
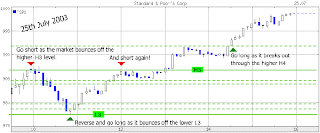
The Camarilla Equation produces 8 levels from yesterday’s open, high, low and close. These levels are split into two groups, numbered 1 to 4. The pattern formed by the 8 levels is broadly symmetrical, and the most important levels are the ‘L3’, ‘L4’ and ‘H3’, ‘H4’ levels. While day trading, traders look for the market to reverse if it hits an ‘L3’ or ‘H3’ level. They would then open a position AGAINST the trend, using a stop loss somewhere before the associated ‘L4’ or ‘H4’ level. To calculate Camarilla Equation Levels (Click on this)
The second way to try day trading with the Camarilla Equation is to regard the ‘H4’ and ‘L4’ levels as ‘breakout’ levels – in other words to go WITH the trend if prices push thru either the H4 or L4 level. This essentially covers all the bases – Day Trading within the H3 and L3 levels enables you to capture all the wrinkles that intraday market movement throws up, and the H4 – L4 breakout plays allow the less experienced trader to capitalise on relatively low risk sharp powerful movements. Here’s what it looks like in action:-
How to use this system:
Look at the opening price for the stock/futures/commodities/currency.
Scenario 1
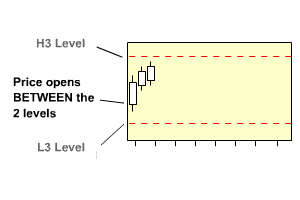
Open price is between H3 and L3
For Long
Wait for the price to go below L3 and then when it moves back above L3, buy. Stoploss will be when price moves below L4. Target1 – H1, Target2 – H2, Target3 – H3
For Short Sell
Wait for the price to go above H3 and then when the price moves back below H3, sell. Stoploss will be when price moves above H4. Target1 – L1, Target2 – L2, Target3- L3
Scenario 2
Open price is between H3 and H4
For Long
When price moves above H4, buy. Stoploss when price goes below H3. Target – 0.5% to 1%
For Short Sell
When the price goes below H3, sell. Stopless when prices moves above H4. Target1 – L1, Target2 – L2, Target3- L3
Scenario 3
Open price is between L3 and L4
For Long
When price moves above L3, buy. Stoploss when price moves below L4. Target1 – H1, Target2 – H2, Target3 – H3
For Short Sell
When the price goes below L4, sell. Stoploss when price moves above L3. Target – 0.5% to 1%
Scenario 4
Open price is outside the H4 and L4
Wait for the prices to come in range and trade accordingly.
To calculate Camarilla Equation Levels (Click on this) or Bookmark this Link:http://pivotpointscalculator.blogspot.com/


Hi,
With help of Camarilla pivot formula, I plotted H3 and L3 for current month on monthly chart. Now the stock price has hit both H3 and L3 in the first week itself. So now how the price will move for remaining week. Will it again turn around and hit H3 (on reversal) or move around L1 and L3 levels.
Dear sir,
Can you provide the backtest results using the camarilla pivot points.
It ll be very usefull for the day traders like me if you could post an article on how to trade with the camarilla using the MACD and RSI indicatiors for better performance.
Thanks and Regards,
Dhamodaran.G
Dear Sir,
For Nifty Trading, which numbers more useful, Nifty Spot or Nifty Future.
Dear Sir,
I always do my analysis on NS cash
Rgds,
Bramesh
what is the best forex tools to analyze camarilla pivot? thanks
on which time frame we use this system? M5?
Hi Kamilos,
You can use on all time frames as time frame increased the targets and SL will also increase
Intra day it works most effectively
Sidhartha, I too would like to see backtesting results. This is a common necessity for day traders though, as it teaches the tenant of “taking profits”. Knowing when a mean reversion will take place can turn a long term 100% gain into a 500% gain if you know when the trend will reverse. The biggest sector for these huge increases and reversions are small caps. I like the free reports at http://www.microcapreports.com/ for when I day trade.
Sir,
Thank you very much for sending the copy on excell sheet. I will experiment on some day. Because i am busy with my college examination work
I wish that you will work on predicting the market price also for certain stocks
with regard
govind
Yes sir i have back tested the system myself and results are pretty good but u need to add some indicators like MACD and RSI to get 80% Success Rate.
It would be wonderful to see back testing results for atleast one month on this.