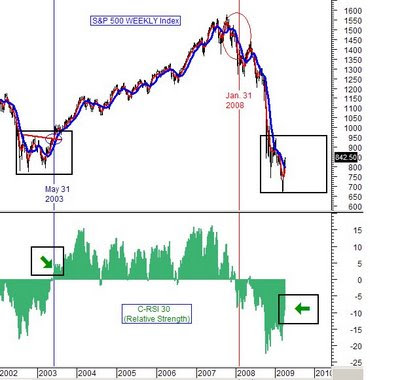
This chart is a simple, weekly chart of the S&P 500 showing the end of of the last Bear Market compared to where we are on this one.
The last Bear Market ended when the S&P broke a trend line to the upside, AND when its C-RSI (Relative Strength) reading went positive.
Now in the current scenario S&P is still not able to cross the Trend line and C-RSI is in neagtive region which adds to the fact that we are still in Bear market and it is a bear market rally.
Now, look at where we are and forget what the TV pundits and analysts are telling you.

