
After the drubbing that Nifty received last week which was highly volatile where on Tuesday we are so close of breaking the 5169 level which is upper end of trading range but on Thursday we gave 4.5% in single session and eventually on Friday broke the lower end at 4900 and closed below it.
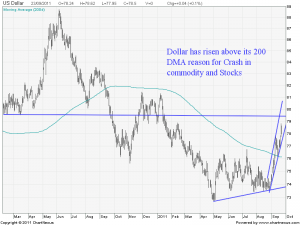
Before going into technical of Nifty for next week want to highlight few observation regrading last week Commodity correction where Crude went below 80$ and Silver cracked 20% Gold 8% worst fall since 2008 was due to rise in Dollar which moved above its 200 DMA of 76 and moved towards 78 levels. Above 200 DMA USD can reach 79 and 81 levels which means more correction in Equities and Commodity
Rise in Dollar is inversely proportion to Equities and Commodities.
Will Fall in commodity will be beneficial for Indian Government ?
The Indian corporate won’t be able to cash in the full benefits of the same. The rupee has depreciated to hit a 2 Year low of 50 versus dollar. Hence, even while CRUDE has come down, the benefit will be nullified as we will have to shell out more rupees per dollar.
Nifty Hourly
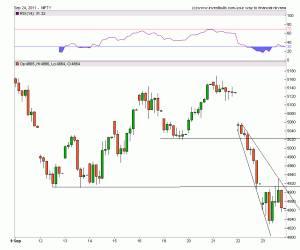 On Hourly charts Nifty is forming a Broadening Bottom formation which is a highly confusing chart pattern as it can give breakout on top with break of 4911 and Breakdown below 4815.
In Trending markets try to avoid trading based on Indicators as they can remain oversold for prolonged period of time frame.
Nifty Daily
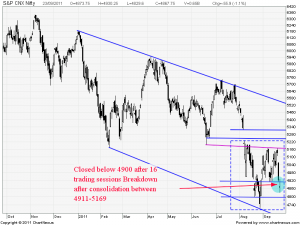 On Daily charts Nifty has closed below 4900 after 16 trading session which technically will be qualified as Breakdown out of trading range of 4911-5169.
Traget of Breakdown comes at 4653.
For Calculation Please Click on This Link.
IF Nifty closes above 4900 on Monday the trade can give a whipsaw,Use Sl of 4930 on Closing basis as stop loss for all Shorts.
Nifty Weekly
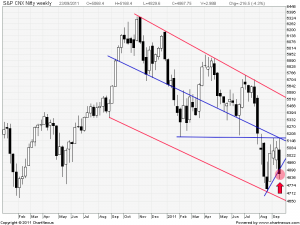 Weekly Charts i pointed on last week nifty has failed to form Higher Highs failing to close above 5169 this week we saw the effect with Nifty closing below 4911 and finally forming Lower Lows.
On Weekly charts Nifty has given a breakdown by closing below last week low of 4911 and in turn also below the Weekly rising trend line.
Nifty closed below 5 Weekly low EMA@4888 which is making it bearish in Weekly time frame also.
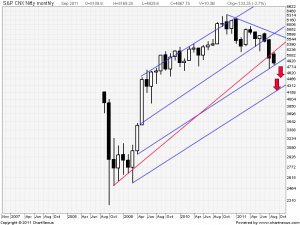
Nifty Monthly
On Monthly charts Nifty broke the monthly low of 4911 after unable to break the Monthly high of 5169. Break of new low of 4830 would lead nifty to 4796 and 26 Aug low of 4720 and finally to our tgt of 4653.
Nifty Fibonacci
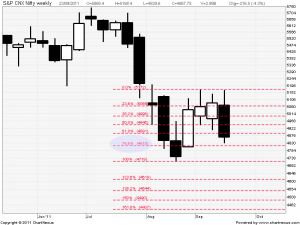 On Fibo charts 4815 is the last support for Bulls and below it probability of hitting new low will increase.
This Week we are having Expiry for september Series
FII till date are Short 118312 Contracts with Open Interest of 7.2 Lakhs Total Open Interest of Nifty is at 2.3 Cores.
Now Till date we were in range bound market from 5169-4911 which broke on Friday.
Bears are in Profit as per FII Data and if they do not Cover Shorts Bulls need to unwind there positions which in turn will create more selling and snowball effect which will lead to more lower levels.
On Contrary,
With so much Short position a Slight Bit of Positive news for Europe and End of Quarter window Dressing can turn the sentiments and lead to Huge Short Covering in Market.
To summarize its a Volatile Week lying ahead with bearish bias which if traded with proper plan can give excellent profit.
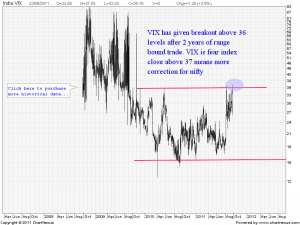
India VIX
VIX broke the 2 year range of 36 and is trading above that levels. Above 37 VIX will favor bears so keep a close watch on it.
Nifty Trend Deciding Level:4955
Nifty Resistance:5001,5068,5113,5169 and 5196
Nifty Support:4830,4796,4720 and 4675
An Interesting Read to End the Post
The current crisis appears to be spreading across the world. This is the warning signal sounded off by the World Bank’s Chief, Mr Robert Zoellick. He has stated that the way things are going the developing world would start sounding off negative signals very soon. As per him, more than 40% of the developing countries have budget deficits of over 4% of GDP. As a result, if things get worse, they would see major drop in asset prices as well as an increase in nonperforming loans. This in turn would lead to protectionist and populist measures being adopted by these countries. Combine this with the troubles in the advanced economies and we have the perfect recipe for a global turmoil.
Follow on Facebook during Market Hours: http://www.facebook.com/pages/Brameshs-Tech/140117182685863

sorry sir its ichart by mistake i wrote chart nexus thanks 4 reply
No Problem sir
sir sorry to say but i m not found trend line
first i open icharts.in then in left hand side charts option then click on it der i found nifty(edo) charts first and some indicators i find in indicators but its not der will u plz help…..
Dear Pratik,
For Icharts you will not have trend line you need to draw using ms paint.
I got confused with chart-nexus s/w.
Rgds
Dear Pratik,
Use the line given in drawing tools in chartnexus.
Rgds
sir thanks for reply but still how u draw trend line on chart there is no option of trend line in chartnexus softweare.
thank u sir 4 all the posts
Bramesh,
I always get confused by this term “trending Market” because each author has a different way of classifying a market as trending.
Can you define “Trending Market”? is it based on some technical indicator or you just look at last 2-3 days to say to determine the trend
Regards,
– Vinay
My understanding about trending market is like water flowing.
Trending markets will move only 1 direction.
THANKS BRAHMESH SIR FOR THIS INFORMATIVE POST.
Bramesh sirji i wanted to know 2 things from u. 1)- there are so many moving avgs. are using by analist but my question is that which are more important as we know 200dma n ema
50dma 21dma but some time its works but some time doesn’t and also now a days 5,7 day dma ema are using. 1 day i also chatted with rajat k bose he is using 89dma so according 2 u which one u r using.
2)- question in chart nexus there is no function of trend line and fibonacci so sir how u draw on it. will u plz reply.
Dear Sir,
There is no hard and fast rule which sma to be used. Which moving average ur more comfortable with.
trading is more about manging your trading pscycology technicals are just 40% of the game.
Try to develop your plan stick with it.