


USD INR GANN Chart

USD INR heading towards 82.80-82.75 till below 83.38
USD INR Supply Demand Zone
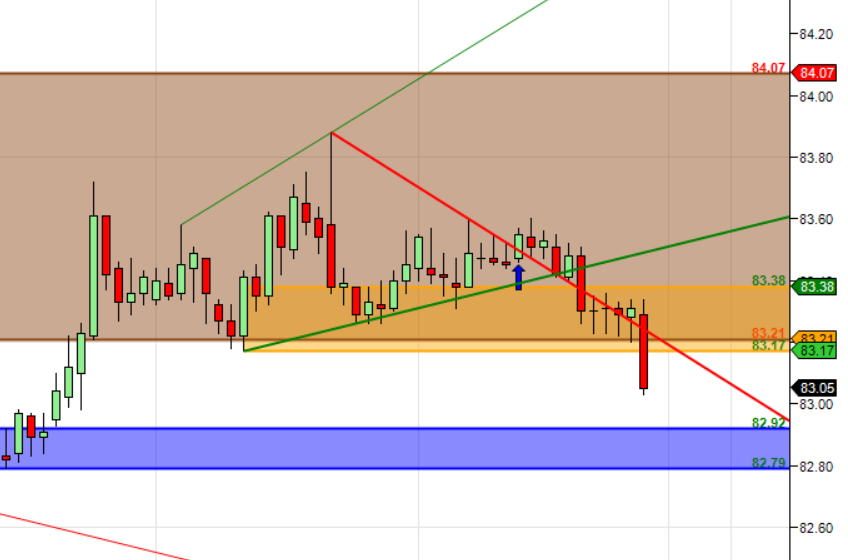
India Rupee Supply Demand Chart : Demand in range of 82.92-83 Supply in range of 83.38-83.50
USD INR Harmonic

Price is forming the D Leg of Alternate ABCD Pattern heading towards 83/83.10 till below 84
USD INR Astro/Gann Trend Change Date
Major Trend Change date for INR is 27 May
Weekly Trend Change: 83
Weekly Resistance: 83.15,83.30,83.50,83.65
Weekly Support: 82.85,82.65,82.50
Levels Mentioned are for June Contract of USD INR
About the Author
Bramesh Bhandari
Technical Analyst, Trader, and Educator publishing daily market geometry, W.D. Gann levels, and financial astrology cycles since 2008. Creator of custom TradingView Pine Script scanners for Nifty, Bank Nifty, Gold, and Global Indices.
Educational Disclaimer: Content is strictly for educational purposes and is not SEBI-registered investment advice. Trading involves risk.