The key to trading success is emotional discipline. If intelligence were the key, there would be a lot more people making money trading… I know this will sound like a cliche, but the single most important reason that people lose money in the financial markets is that they don’t cut their losses short.”
IDFC
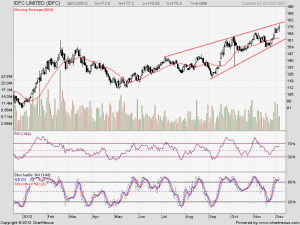
IDFC is trading perfectly in trendline channel and is nearing the trendline resistance of 178.3-178.7.Stock has hit a fresh 42 week high yesterday. Profit booking and shorts can be taken near 178.7 range.
Buy above 175.6 Tgt 177.2 and 178.5
Sell in range of 178.5-178.8 Tgt 177.4,176.3 and 174.2
Indian Bank
 Indian Bank is facing trendline resistance at 192, Close above same with volumes on hourly charts can see a fresh breakout.
Buy above 192 Tgt 194.6,197 and 199
Dish TV
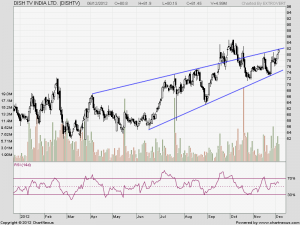
Dish TV is near its trendline resistance, Most of stock are near trendline resistance and having negative divergence which makes me cautious on market. Traders holding in cash should use this to book profit and Future traders can take shorts in small quantity as trend is up in nifty.
Sell below 82 Tgt 81.6,80.4 and 79.4
All Levels mentioned are Spot levels. Trade with a Sl of 0.5-1% as per your risk profile. Trade as and when level comes. DO’nt chase the trade.


