


Advanced Gann Price Scanner for TradingView
Gann Trend Engine: Institutional Proximity Scanner
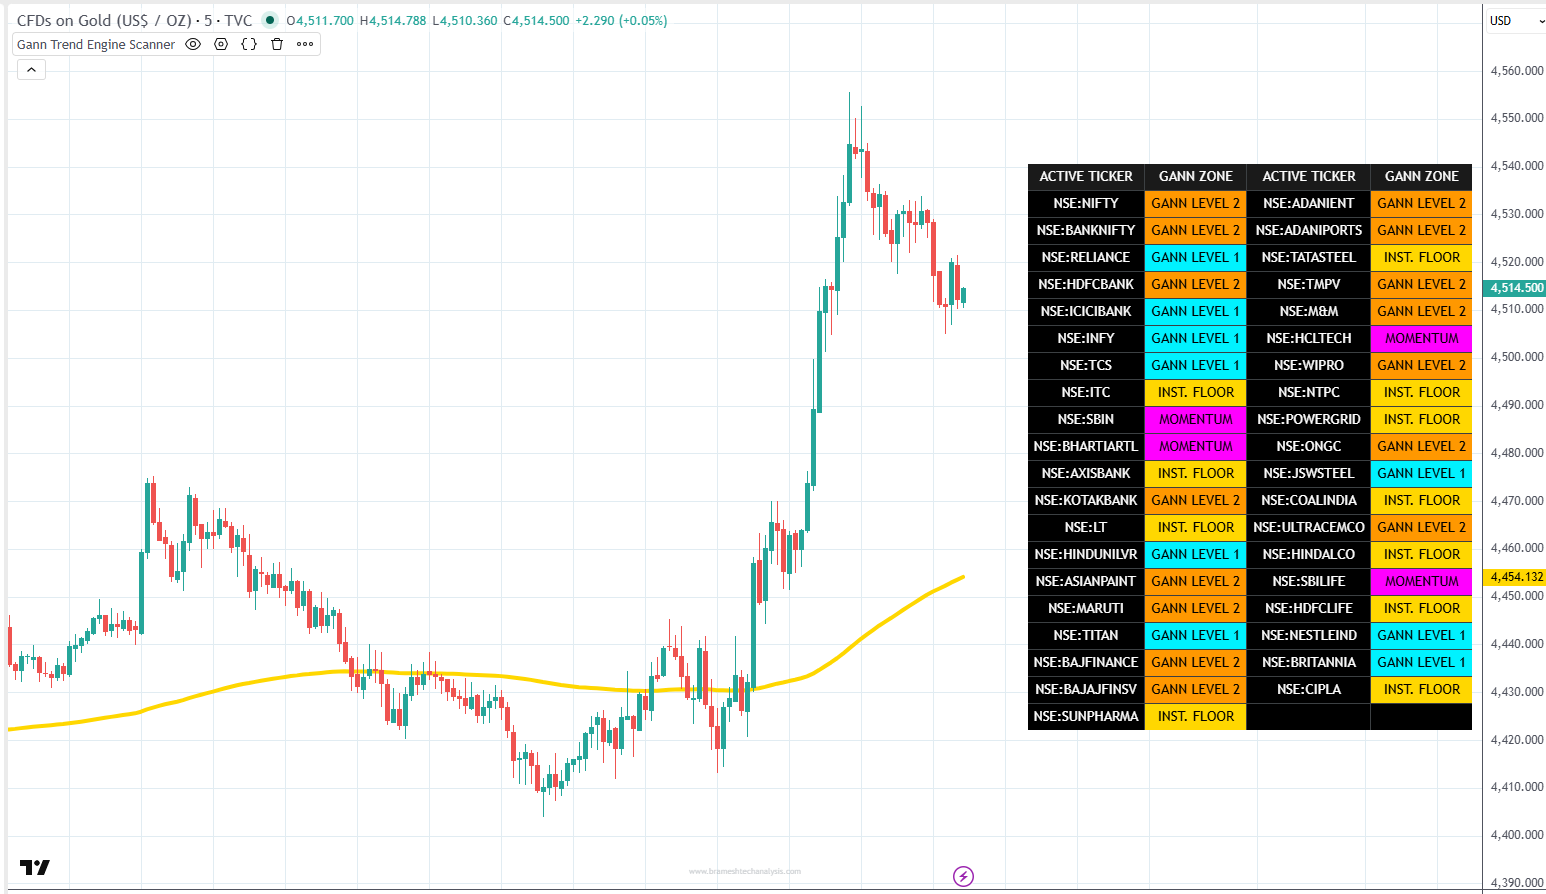
Unlock the power of advanced market analysis with the Gann Trend Engine Scanner (v6) – your ultimate institutional-grade toolkit for monitoring the entire Nifty 50 and beyond. Engineered for elite traders who demand speed and precision, this scanner integrates Gann’s core equilibrium principles with a high-speed multi-ticker dashboard.
🔹 Key Features:
✅ 40-Stock Institutional Watchlist – Simultaneously monitor the heavyweights of the market, from NIFTY and BANKNIFTY to top-tier blue chips 🚀 ✅ Smart Proximity Filtering – Instantly filter out the noise; the scanner only highlights tickers within a 0.5% range of critical Gann Precision Zones 🎯 ✅ Multi-Level Identification – Gain clarity with color-coded alerts for Institutional Floor (200 EMA), Gann Level 1, Gann Level 2, and Momentum zones 📊 ✅ Dynamic Stealth Interface – A movable, vertical dashboard (v6 optimized) that keeps your workspace clean while delivering real-time institutional data 📈
🚀 Ready to elevate your trading experience? Step into the future of automated market surveillance with the Gann Trend Engine Scanner and stop chasing the market—let the high-probability setups find you!
💎 GANN LEVELS SCANNER
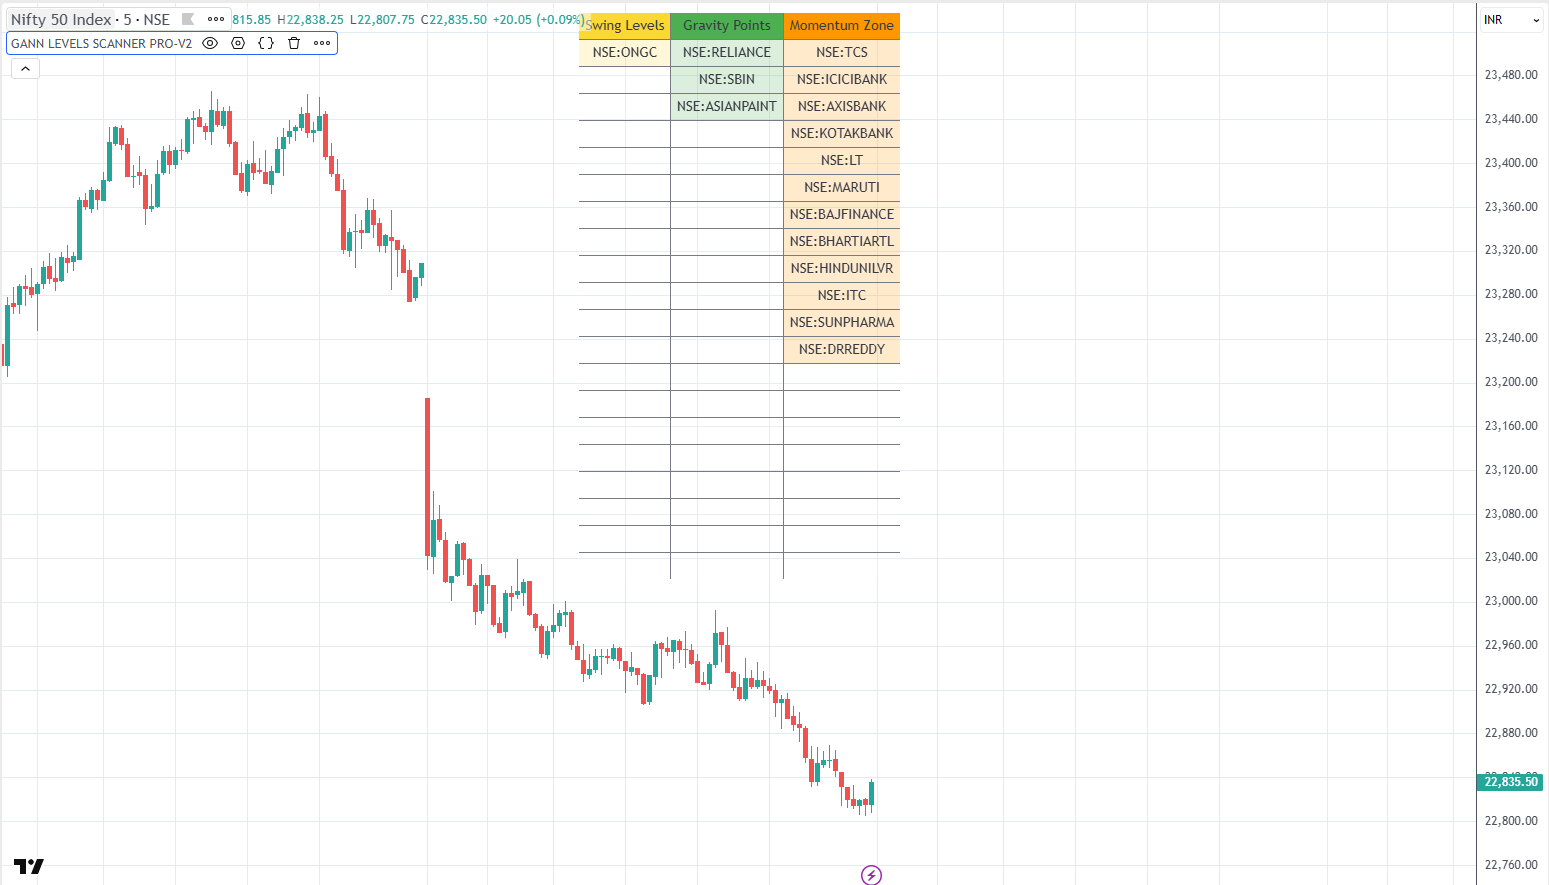
The GANN LEVELS SCANNER is a professional-grade market surveillance tool designed to identify symbols currently interacting with high-mathematical-vibration price points. Built on the latest Pine Script v6, this scanner monitors up to 40 assets simultaneously, filtering them into specific Gann categories based on proximity to pure Square and Cube numbers.
🔹 Key Features:
✅ Triple-Layer Vibration Detection – Instantly categorizes stocks into Swing Levels , Gravity Points , and Momentum Zones 🚀 ✅ Real-Time Proximity Filtering – Use the customizable 0.5% Threshold to ensure you only see symbols that are “In Play” right now 🎯 ✅ Adaptive UI Architecture – Switch between Horizontal and Vertical layouts with 6 different docking positions to fit any charting workspace 📊 ✅ Multi-Asset Versatility – Hard-coded for the top 40 NSE/Blue-chip symbols but fully customizable for any market or asset class 📈
🚀 Ready to find the “Hidden” support and resistance? Deploy the GANN LEVELS SCANNER and let geometry guide your trading decisions!
🔭 Dhruva Drishti: Monthly Breakout Terminal
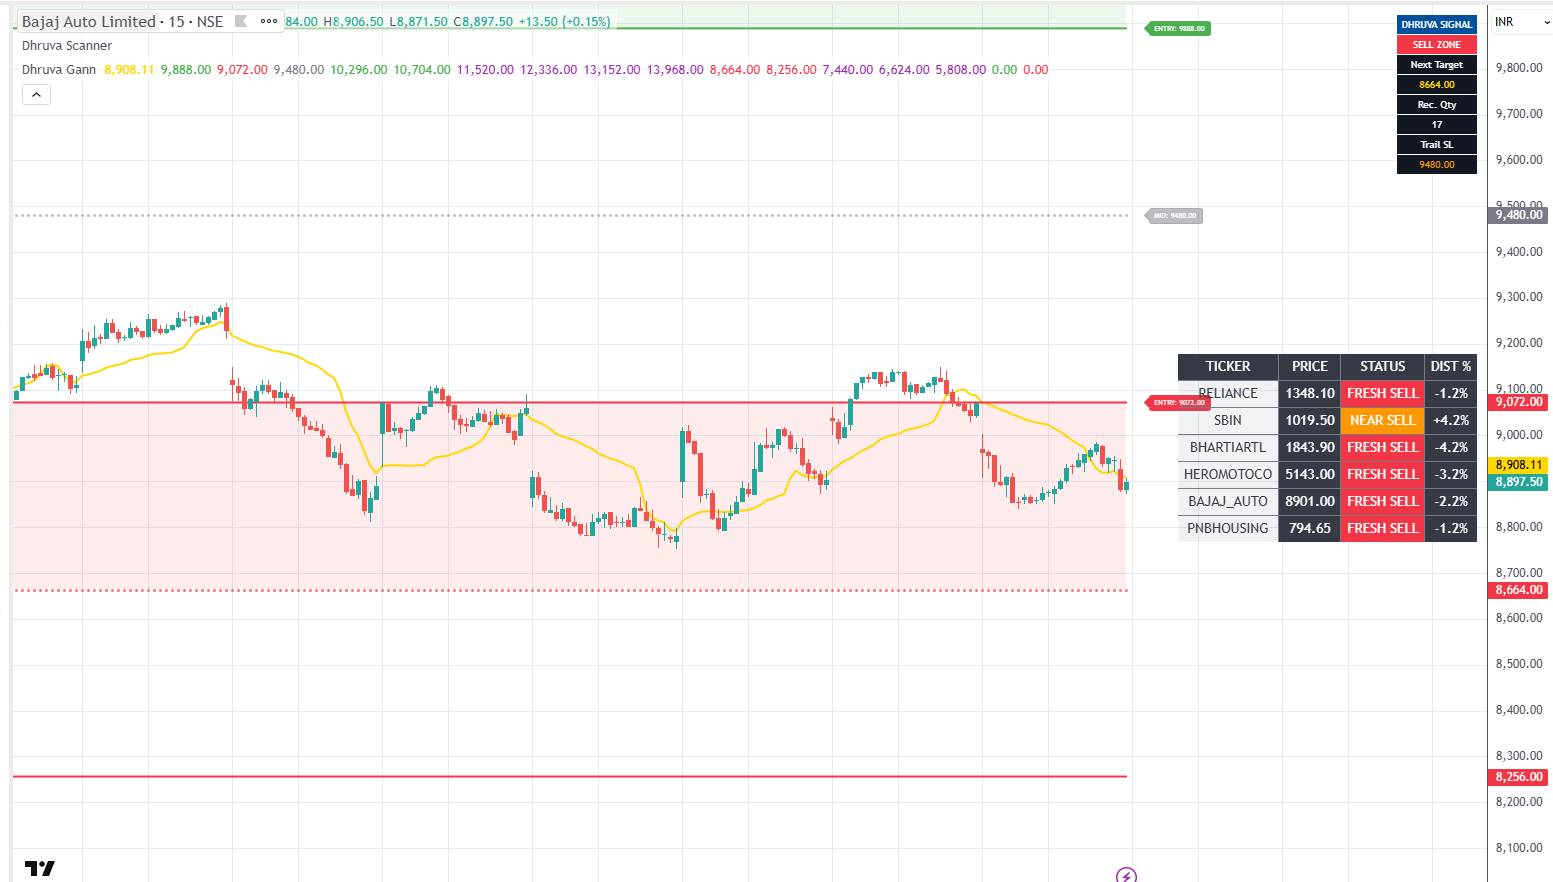
The Dhruva Drishti Scanner is an institutional-grade surveillance tool that monitors up to 40 stocks against a fixed historical reference point. Designed for Pine Script v6, it calculates the distance between the current live price and a specific monthly range (January), identifying “Fresh” breakouts or breakdowns the moment they happen.
🔹 Key Features:
✅ Fixed Reference Logic – Anchors your strategy to a specific month’s High/Low (Gann-style reference) to identify the true yearly trend 🚀 ✅ Intelligent Proximity Filter – Only “Active” stocks appear on your dashboard. If a stock is too far from its level, it is hidden to keep your focus on tradeable setups 🎯 ✅ Live Status Engine – Instantly categorizes stocks as FRESH BUY, FRESH SELL, NEAR BUY, or NEAR SELL based on real-time price action 📊 ✅ Movable Stealth Dashboard – Choose from 5 different screen positions to integrate the scanner seamlessly into your unique TradingView layout 📈
🚀 Ready to lock your vision on the trend? Deploy the Dhruva Drishti Scanner and trade with the confidence of fixed-level mathematical precision!
💎 Gann TC & SAP Scanner: Institutional Surveillance
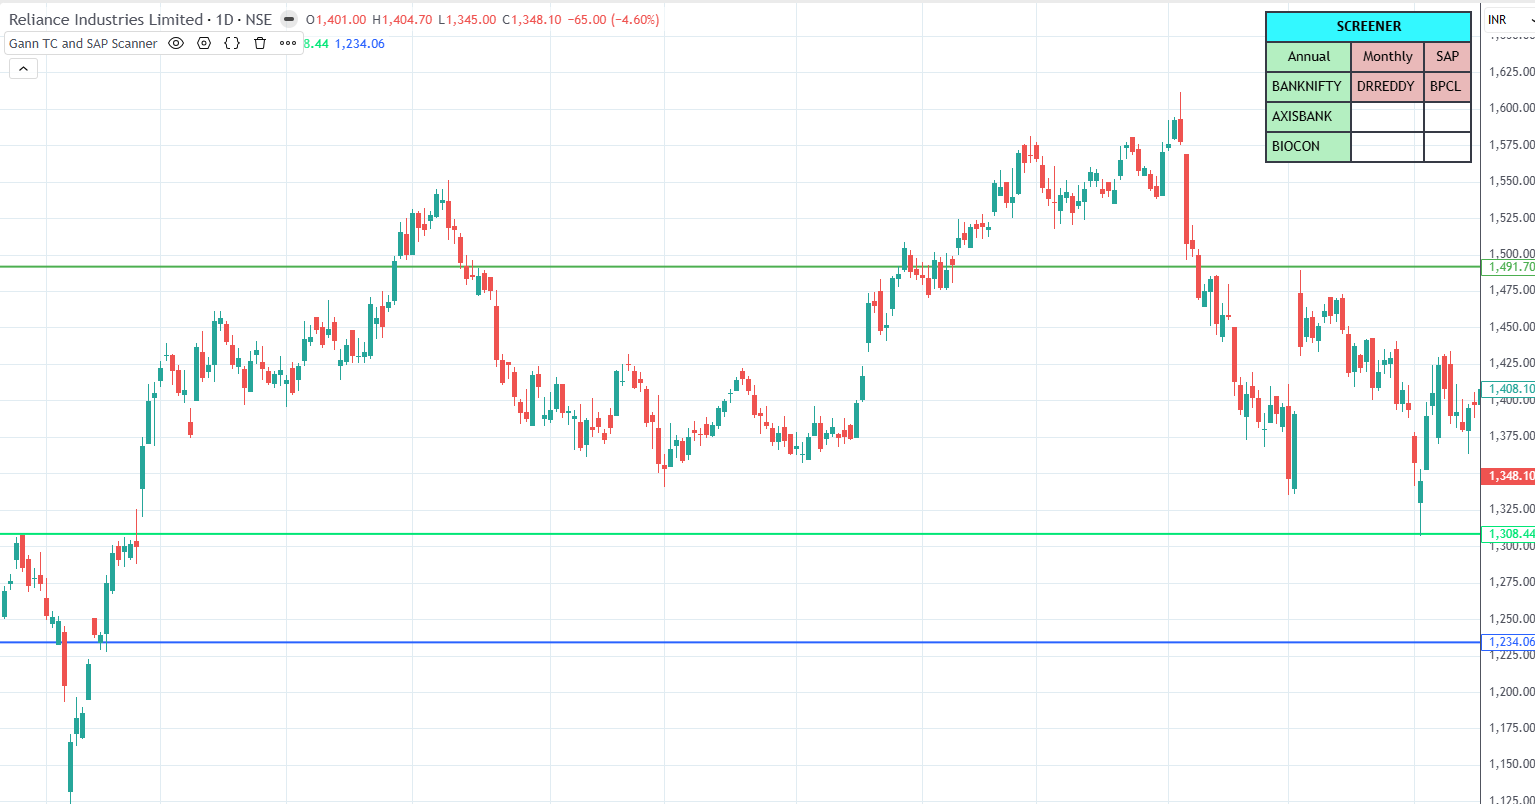
The Gann TC & SAP Scanner is a professional-grade multi-asset terminal built on Pine Script v5. It monitors up to 40 symbols simultaneously to detect when the price enters a “Value Zone” based on historical time-cycle averages. This isn’t just a moving average; it is a calculation of the market’s “fair value” during critical historical windows, projected forward as a support or resistance level.
🔹 Key Features:
✅ Triple-Cycle Monitoring – Tracks Annual TC, Monthly TC, and SAP TC levels across 40 customizable symbols in real-time 🚀 ✅ Smart Proximity Screener – Features a dynamic dashboard that highlights symbols only when they are within a specific percentage (Allowed Per %) of a major Gann level 🎯 ✅ Integrated Trend Confirmation – Includes 4 customizable SMA/EMA toggles to provide instant trend context alongside Gann levels 📊 ✅ Live Alert System – Automatically triggers bar-close alerts when any stock in your watchlist hits a “Fresh Signal” zone (Annual, Monthly, or SAP) 📈 ✅ Drift Analysis Table – A real-time data terminal showing the exact price difference and percentage distance from the current price to your master TC levels.
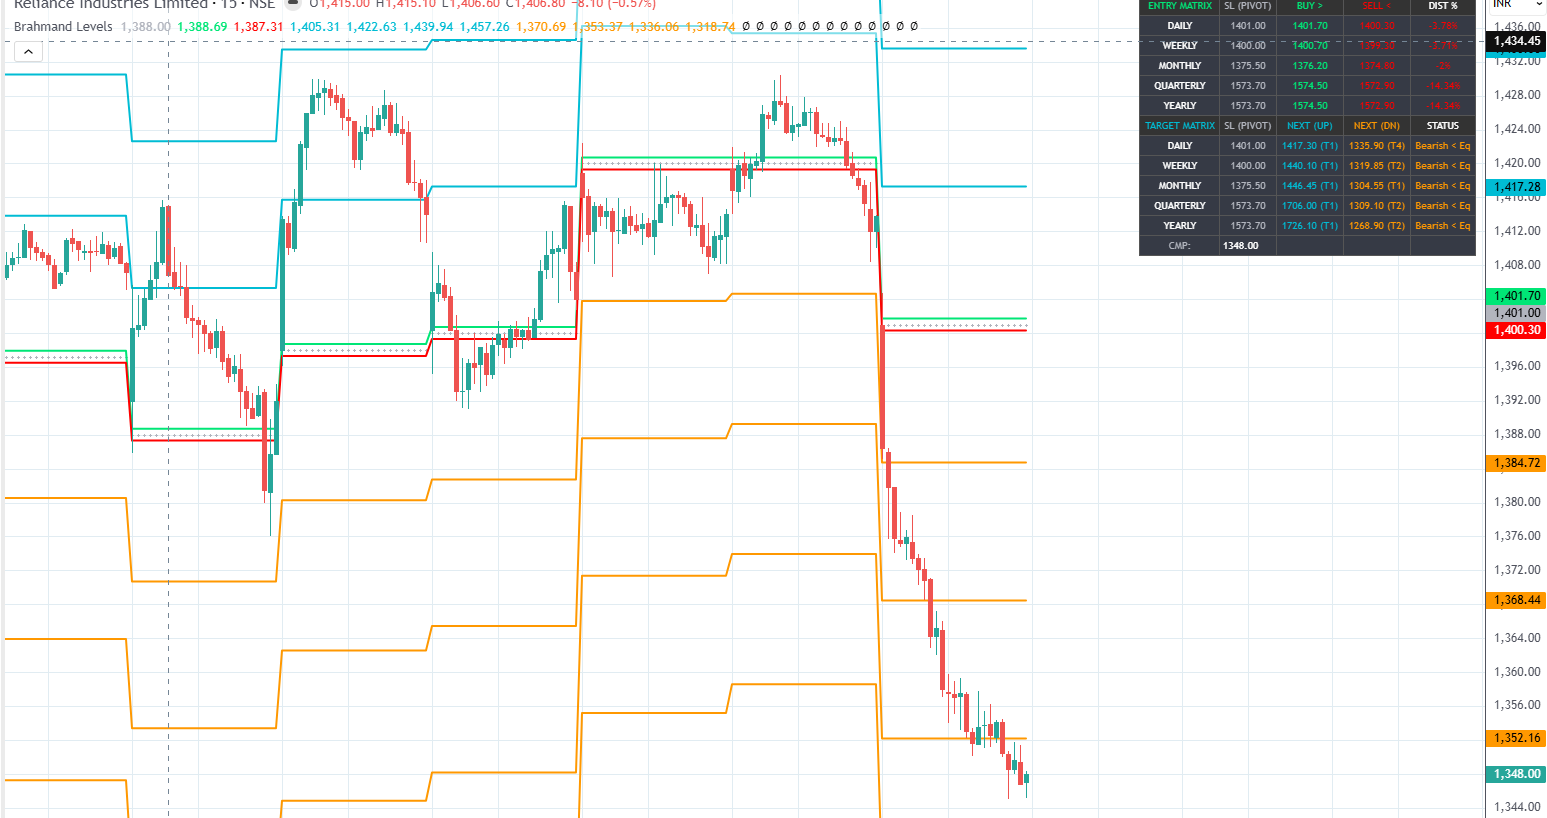
🌌 Brahmand Levels: Professional Market Matrix
The Brahmand Levels indicator is a high-speed mathematical terminal designed for traders who need to see the entire market hierarchy on a single screen. Unlike static indicators, Brahmand levels are “live,” adapting to the current vibration ($Vib$) of each timeframe. It identifies where the market is in “Flux” (Entry Zone) and where it is likely to find its next “Reversal” (Target Zone).
🔹 Key Components:
✅ Multi-Timeframe Equilibrium – Instantly syncs with Daily, Weekly, Monthly, Quarterly, and Yearly horizons to find the master pivot point 🚀
✅ The Flux Barrier – A proprietary buffer around the Pivot ($SL$) that generates Strait Buy and Strait Sell triggers 🎯
✅ Energy Projections (T1-T4) – Projects four levels of mathematical extension up and down, representing 180°, 360°, 540°, and 720° of market movement 📊
✅ Micro-Vibration Grid – Includes 6 micro-levels (0.125 increments) between major targets to capture small intraday fluctuations 📈
✅ Anchored Rolling VWAP – Integrates volume-weighted average price synced to your chosen Chart Plot Horizon for trend validation ⚖️